Still trending up, Bitcoin (BTC) and Ether (ETH) are starting to show signs of uncertainty. What are the scenarios to watch for the next few days? Can the rise continue?
Bitcoin on its way to $46,600?
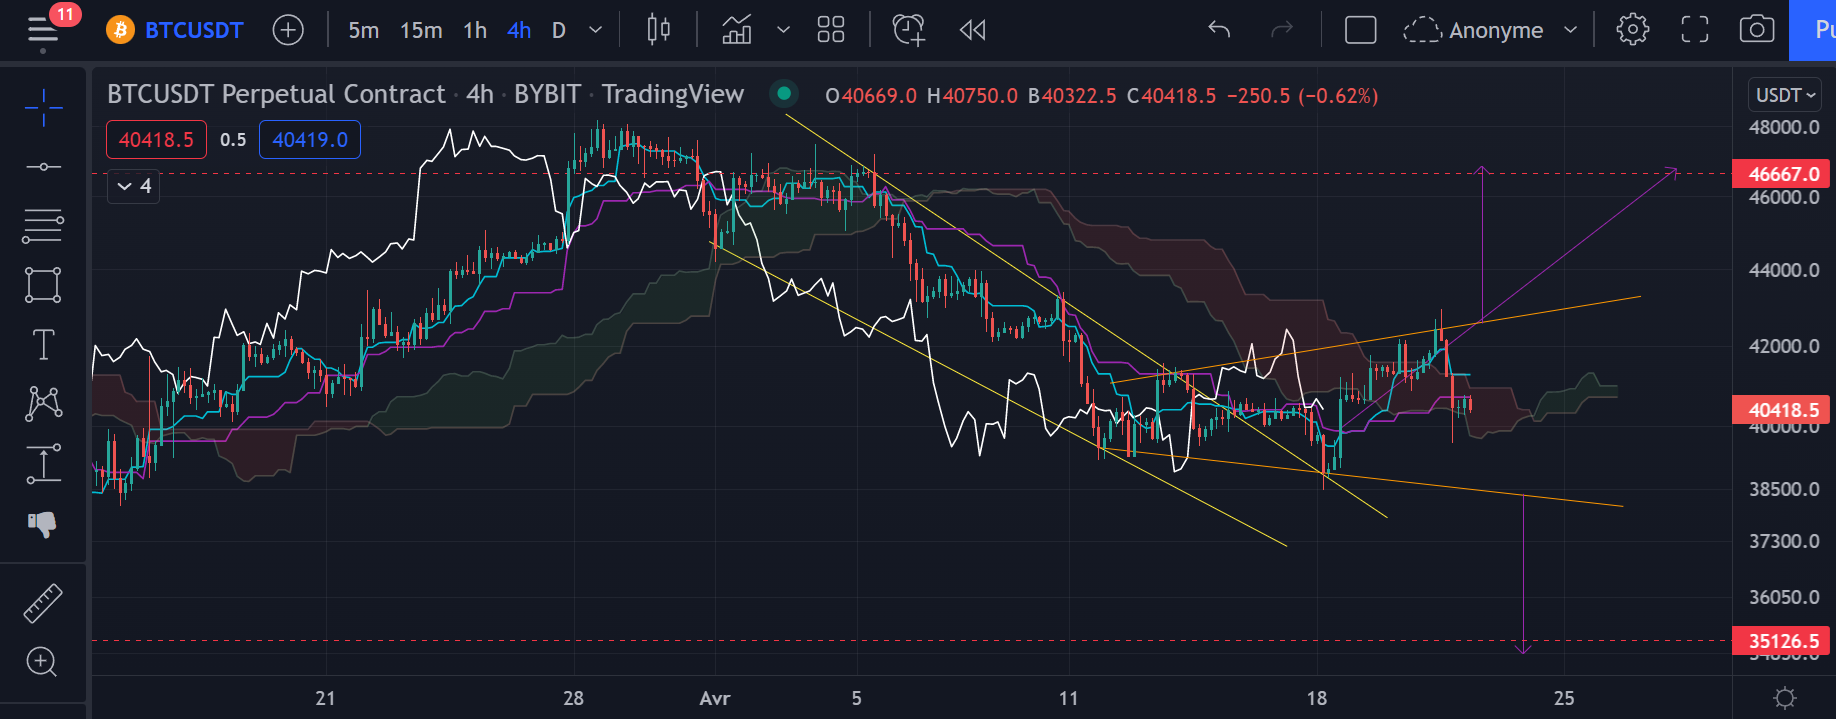
This week, the price of Bitcoin (BTC) held above $40,000 , allowing new short-term bullish momentum to take hold following the breakout of the falling wedge in yellow. Will BTC achieve its goal?

Figure 1: Bitcoin chart (h4)
In chartism , any pattern break triggers an objective. On the Bitcoin h4 chart, we can see that the price has broken two patterns over the past few days. The first being the descending wedge in yellow, giving a high probability of returning to seek the first point of contact on the top of the pattern, around $46,667 . We then notice a symmetric broadening pattern of orange troughs, which generally signals a market reversal and therefore an upcoming rise.
It will then be necessary to monitor the evolution of the price within this pattern, since its breakout will give us the direction of the price for the next few days. If currently there are more chances for the price to come out of the top towards $46,667, the Tenkan and the Kijun remain important resistances to regain support in order to start rising again.
Note that the objective of the wedge in yellow is exactly the same as that of the figure in orange, so we have a double objective which further improves the chances of returning to this price level. Despite this, if the price were to break its broadening pattern from below, a return to $35,126 would be possible, which would therefore invalidate the objective of breaking the bevel.
Ether remains bullish
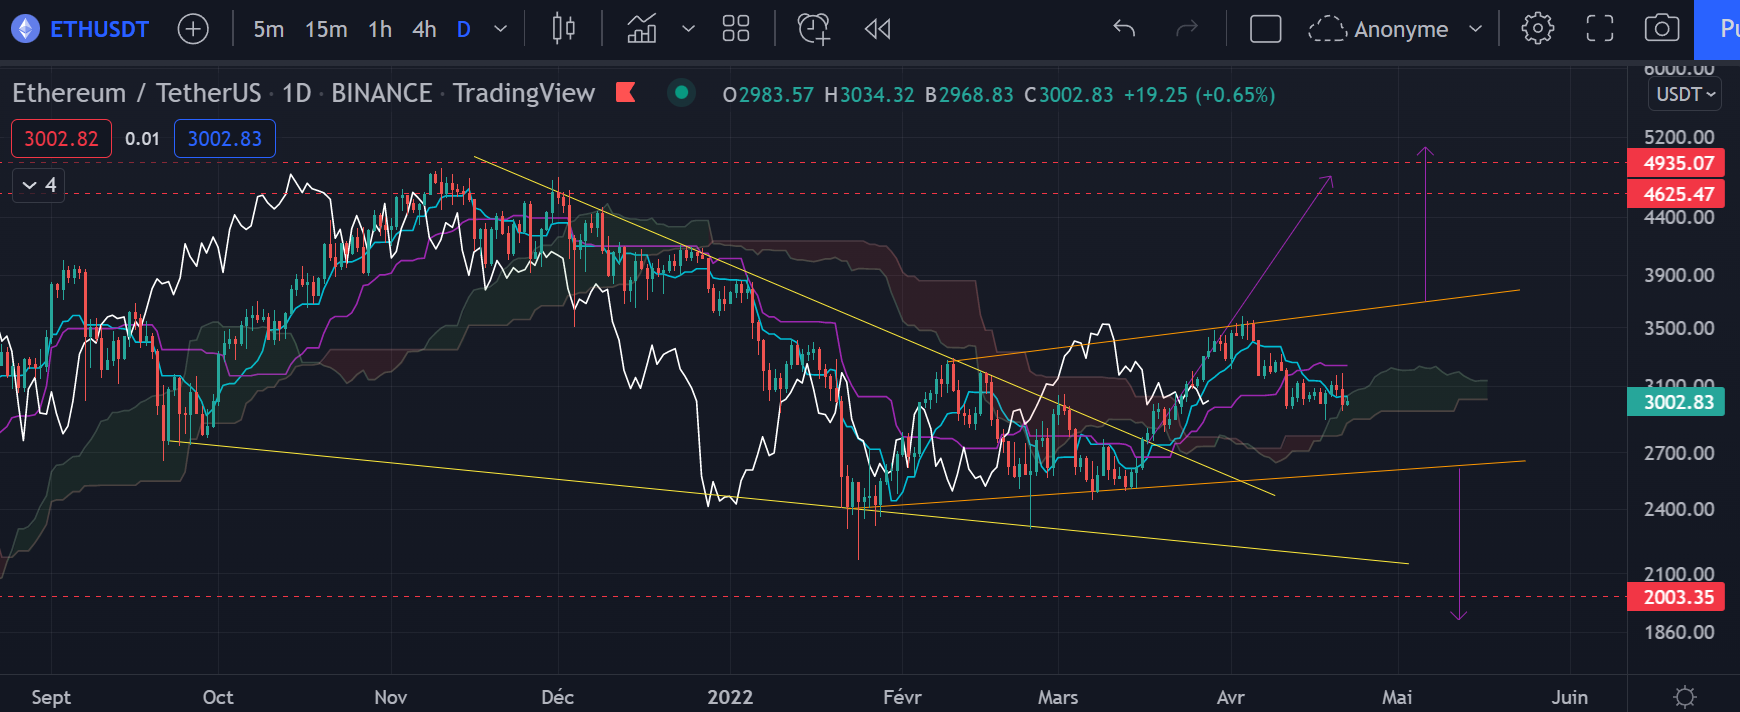
Despite a correction in its price over the past few days, the price of Ether (ETH) remains in an upward trend since it does not break the Ichimoku cloud and does not make a new dip lower than the previous ones.

Figure 2: Ether (ETH) chart in Daily
Following the breakout of the triangle in yellow built during the previous months, we were able to determine a bullish objective for Ether at $4,625 (highest contact point inside the pattern).
Now a new pattern has emerged, this is the bullish channel in orange. If for the moment the price seems to want to rebound on its support at $3,000 (also corresponding to the cloud), it will above all be necessary to regain the Kijun in support. It is acting as resistance for the moment and could unfortunately lead the price towards $2,000 in the event of a breakout of the pattern from below.
It is therefore important to continue this initiated trend, which this time could take us towards $5,000 in the coming weeks if it continues (channel height reported at the breakout point).
In conclusion
Bitcoin and Ether remain in a bullish pattern for now , despite signs of uncertainty. Nothing to worry about as long as the price of cryptocurrencies remains within the patterns we have identified. The market very rarely goes in a straight line, so these corrections remain healthy, but it will be imperative to bounce back and preserve this momentum in the coming days.


