Following a cleanup in the derivatives market, some short-term cryptocurrency holders are exiting their positions in response to the volatility of the Bitcoin (BTC) price. On-chain analysis of the situation.
Bitcoin (BTC) shakes small carriers
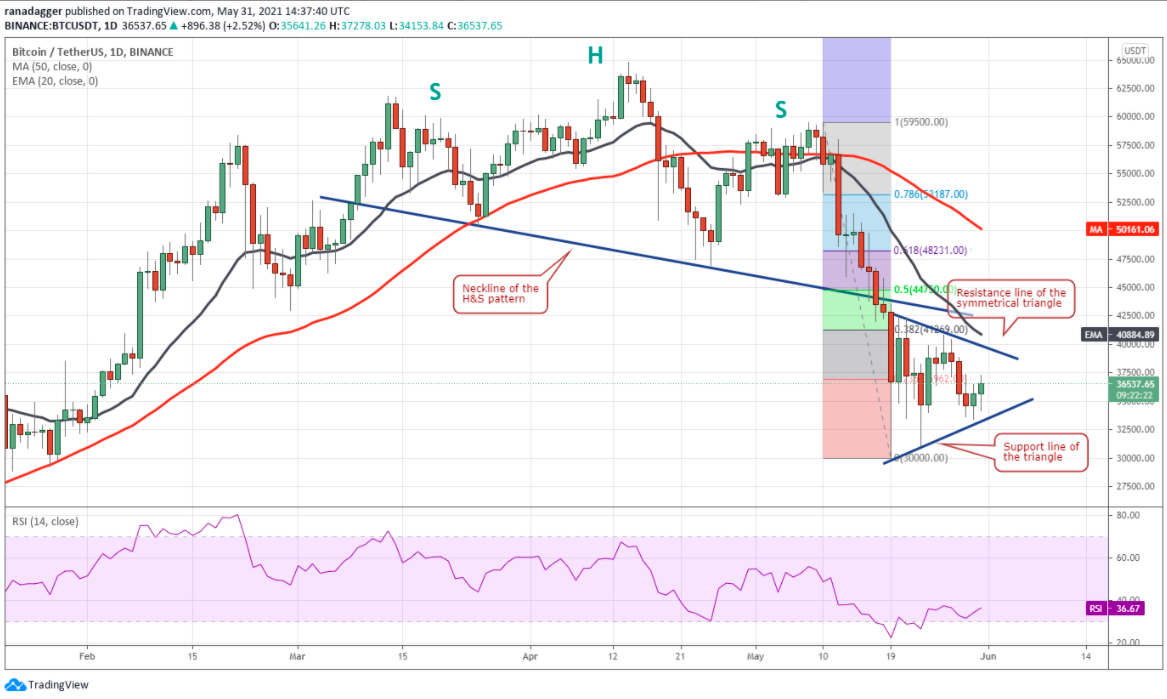
Trying to bounce back, bitcoin (BTC) is bottoming at $ 55,573 after losing $ 60,000 support , now considered a weekly high .
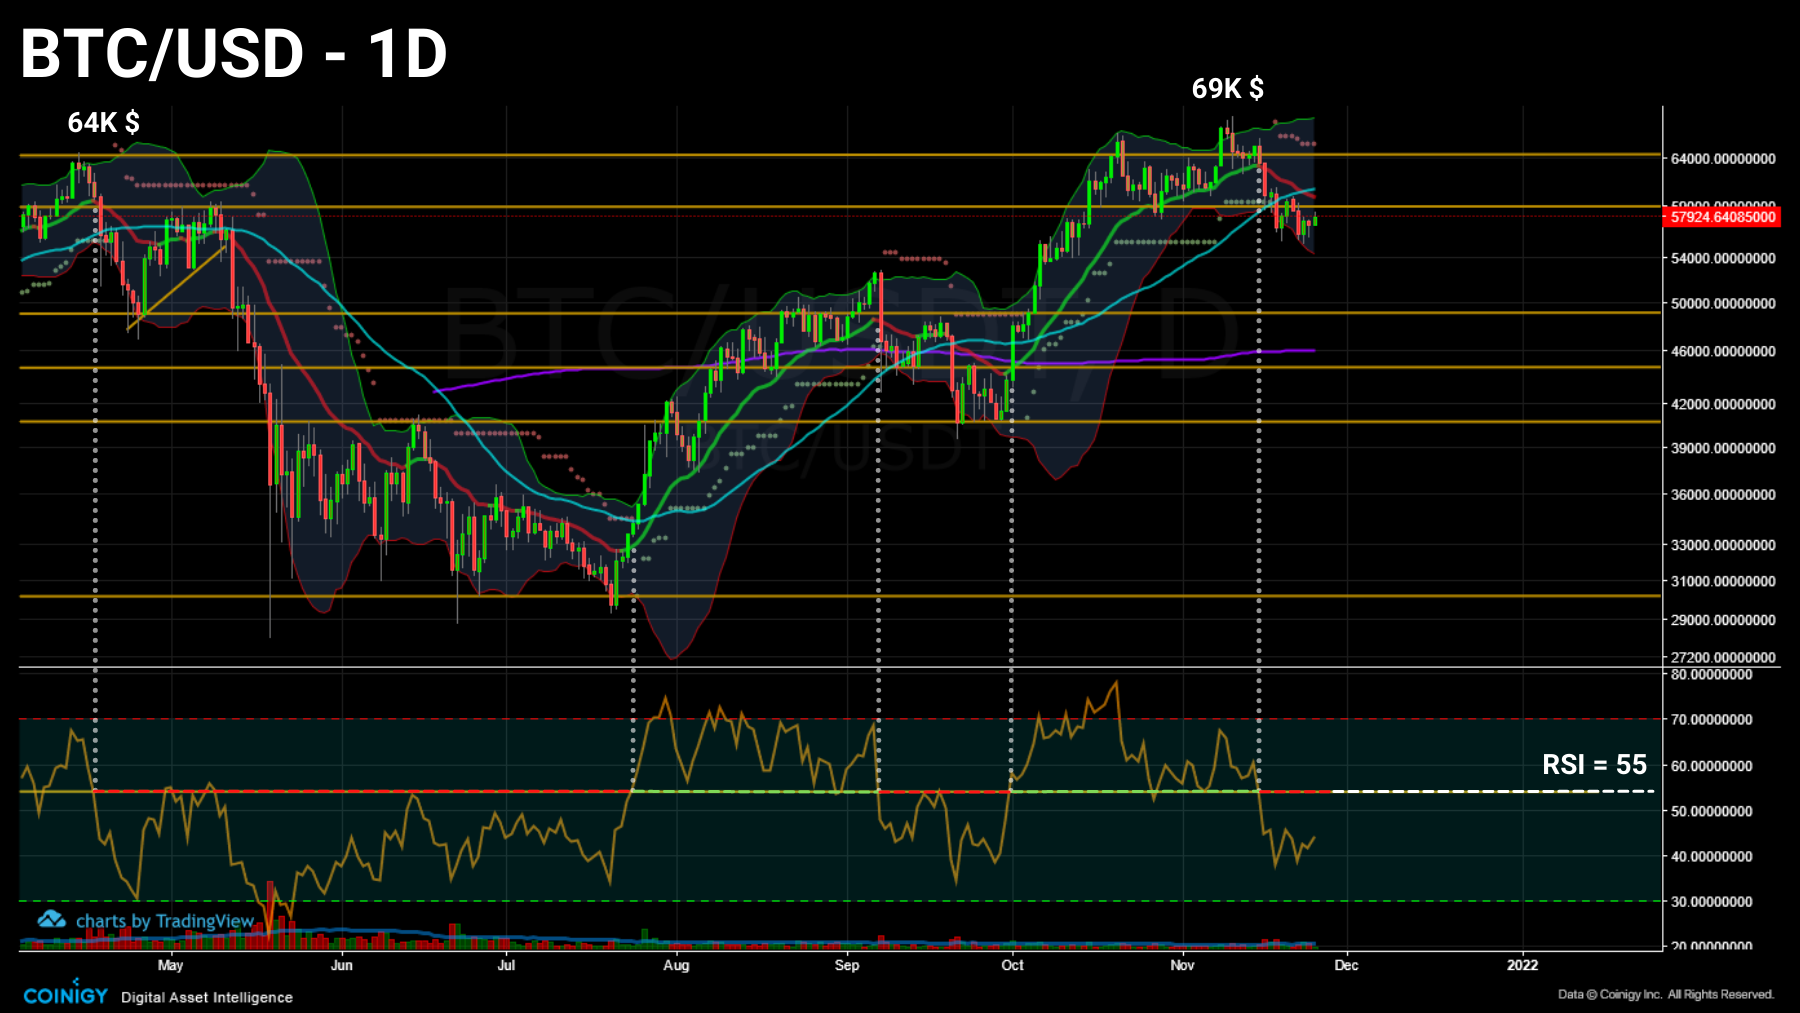
Daily Bitcoin Price Chart (BTC) – Source: Coinigy
Oscillating in a large cluster of volume between $ 54,000 and $ 59,000 , Bitcoin has recently strained the nerves of many participants by testing price areas that some short-term holders would have been careful not to. revisit.
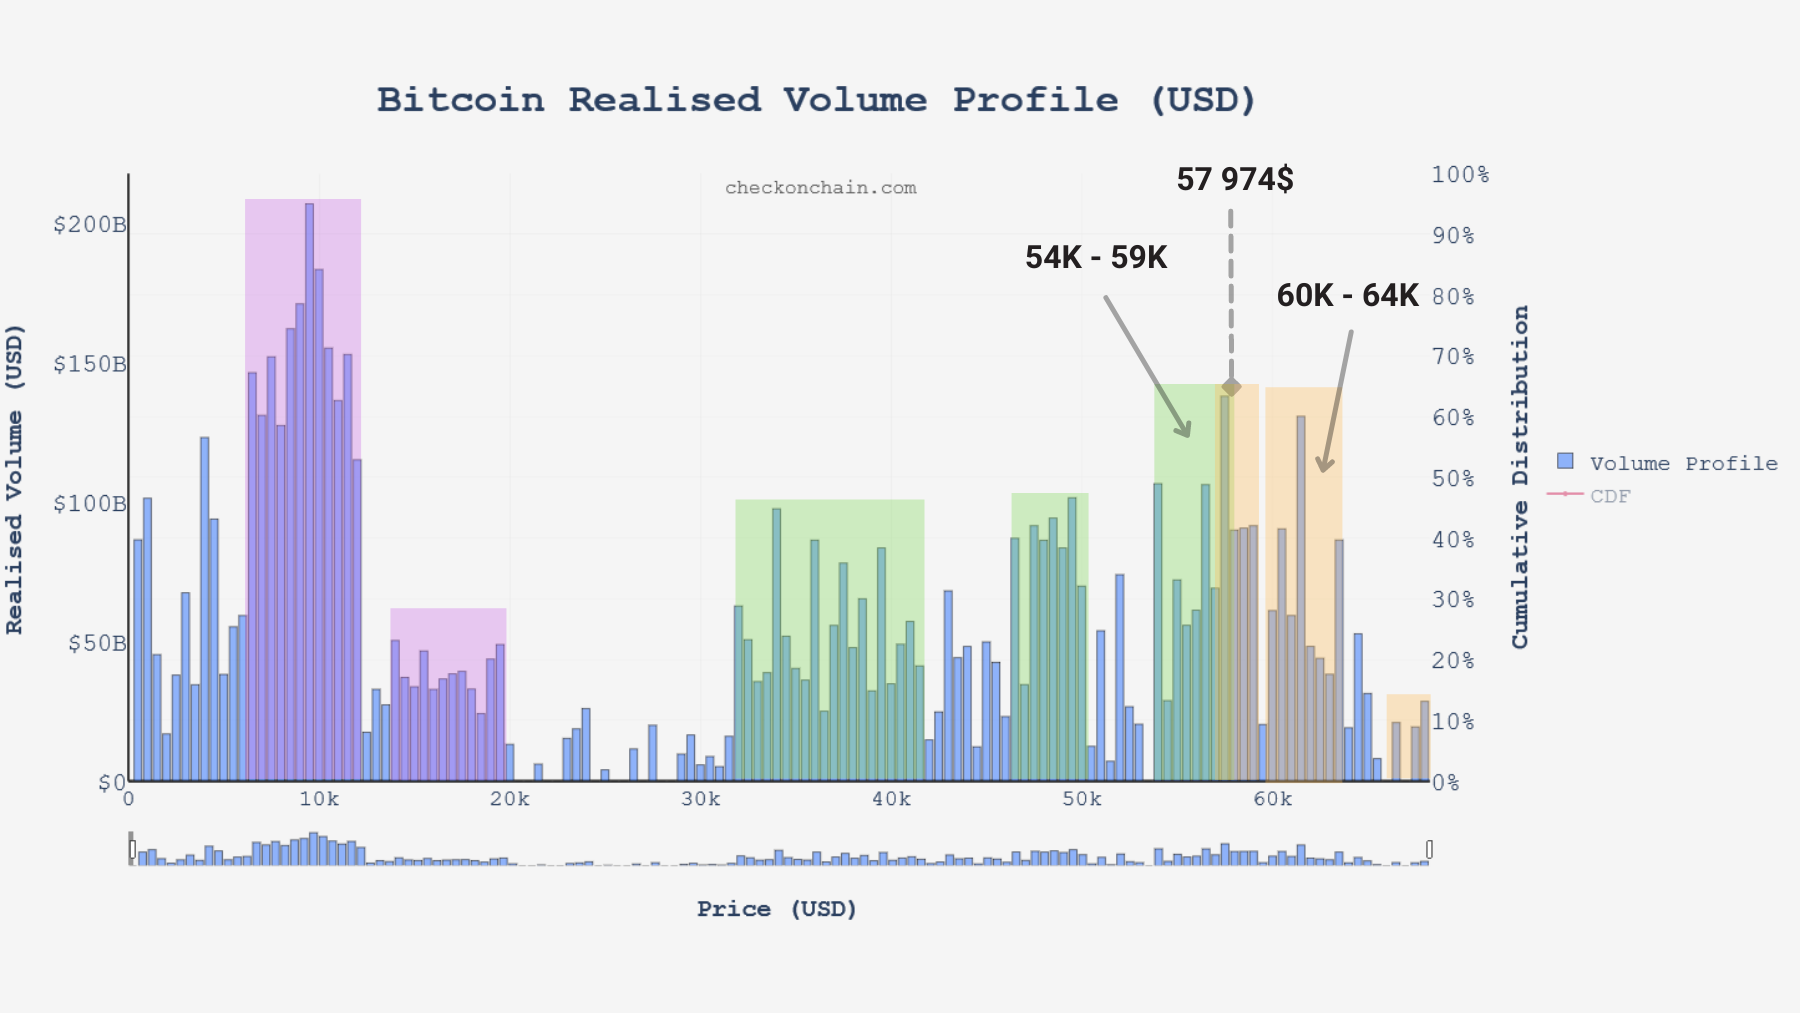
Bitcoin Realized Volume Graph (BTC) – Source: checkonchain.com
Let’s take advantage of this consolidation to take advantage of the metrics mentioned in the last analyzes and study:
- the current position of derivative markets ;
- the point of maximum pain incurred by STH ;
- the spending behavior of LTHs .
Tensions drop in derivatives markets
First, the cleanup mentioned last week continued , with the fall in the price pushing speculators to move away from financial derivatives.
Falling 15%, open interest in BTC hit a monthly low of $ 22.3 million , offloading the market of excess risk.
With perpetual contracts trading at a slightly positive rate, optimism appears to have returned to a reasonable level despite the growing influence of derivatives markets since early 2021.
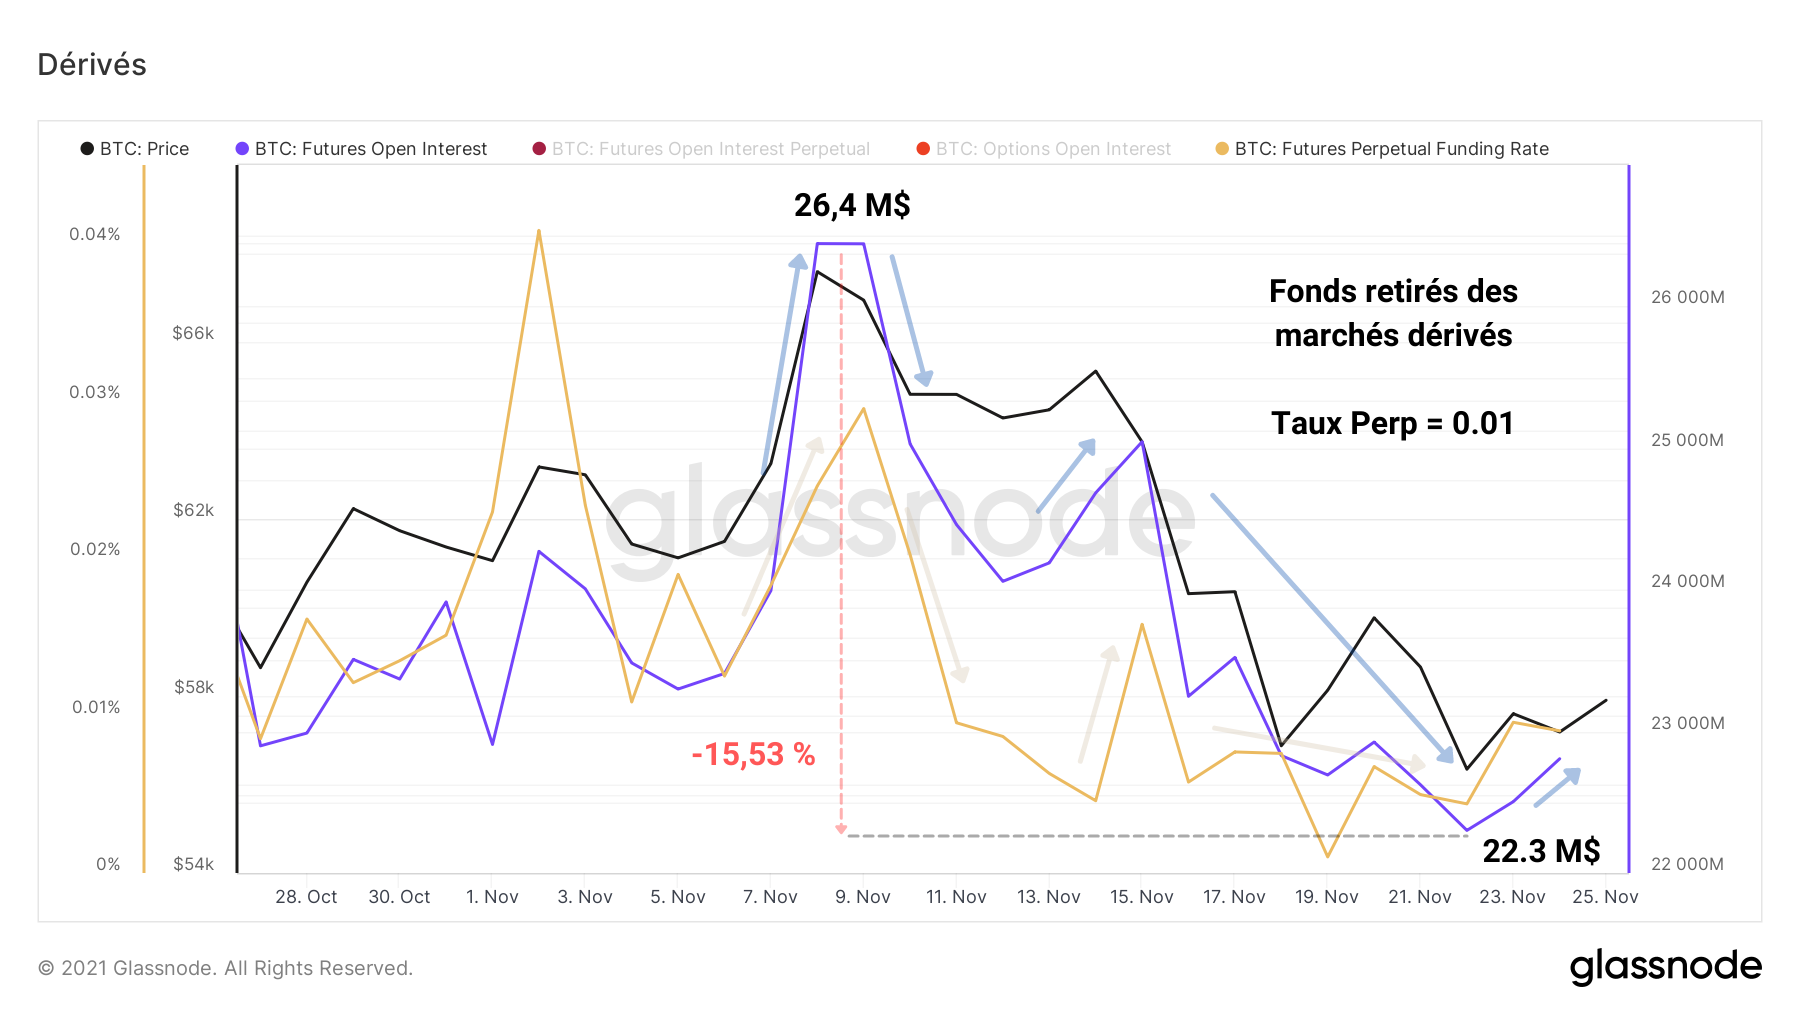
Bitcoin Open Interest Chart (BTC) – Source: Glassnode
As evidenced by the liquidation account, a decreasing number of positions have been forced since last Friday, a sign that some speculators have learned the lesson… until next time.
The turn would ideally have come for the spot markets to take over in order to relaunch a healthy rise, based on direct demand.
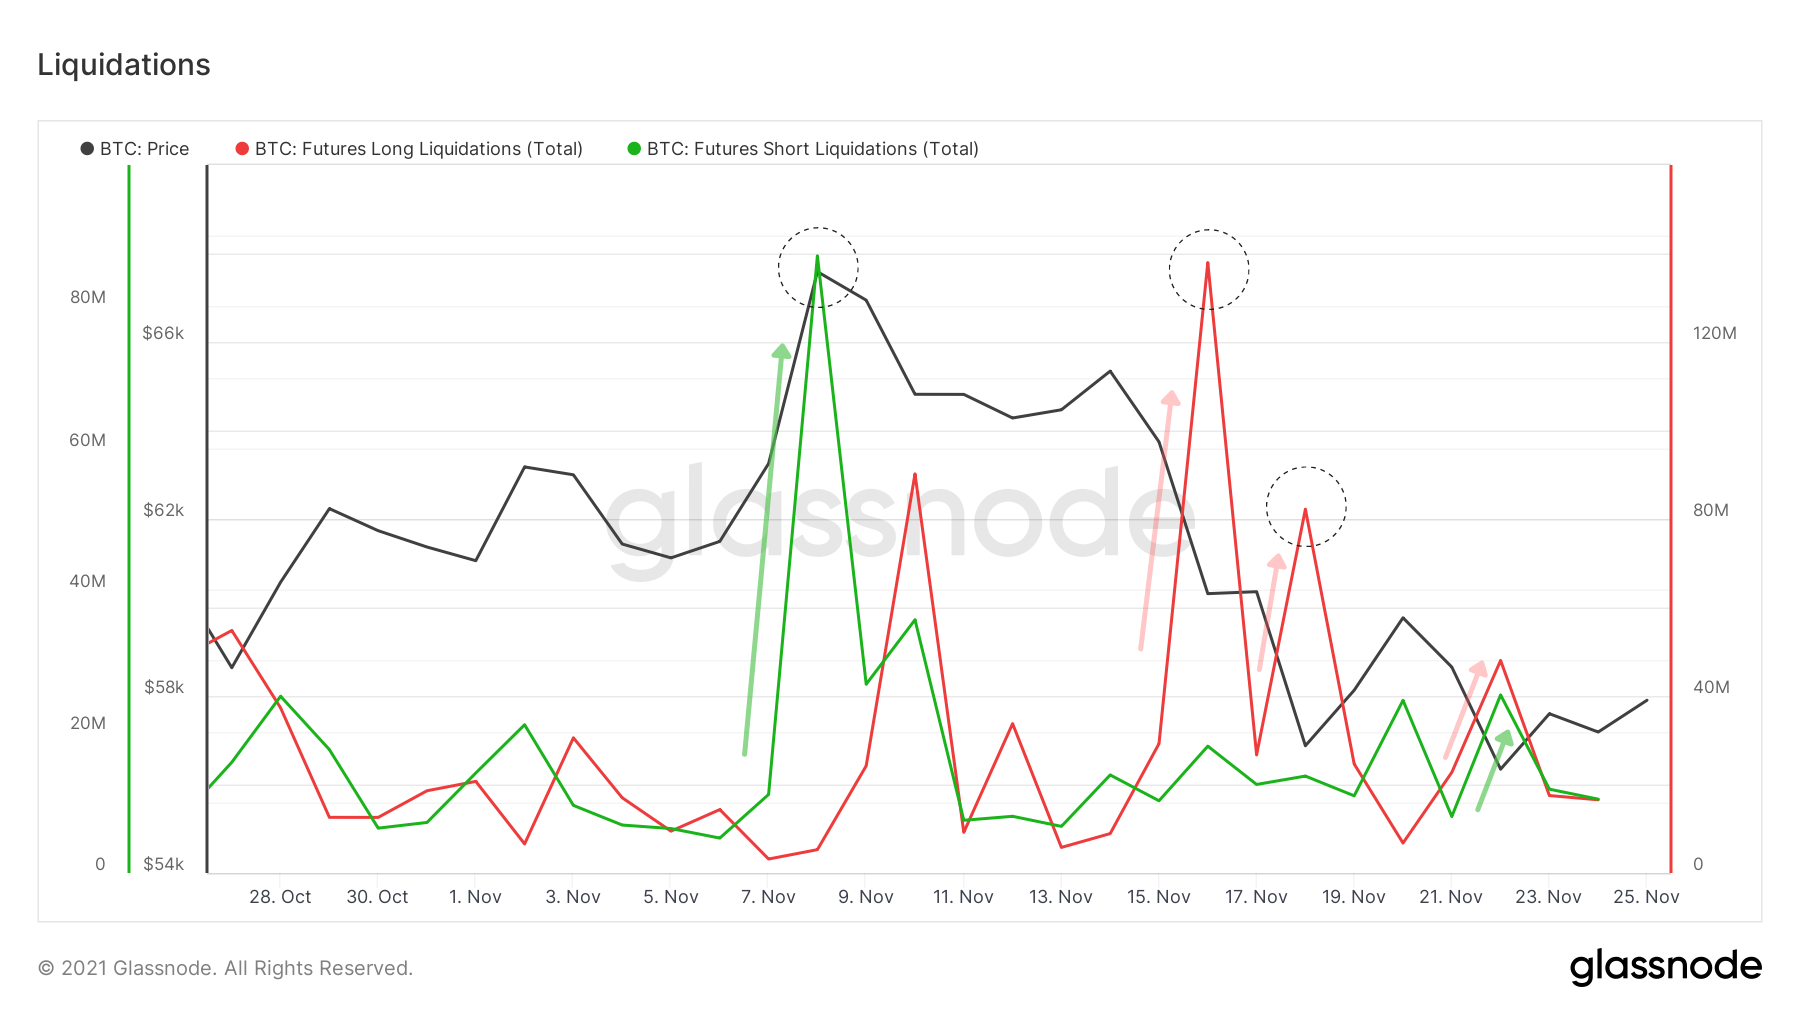
Bitcoin Futures Contract Closeouts (BTC) Chart – Source: Glassnode
High added value content that is quick to consume
A painful week for STH
To follow, let’s turn our attention to another cohort whose impact on the recent correction should not be neglected: STH .
Meaning Short Term Holders , this term brings together short-term holders of various kinds (new entrants, active traders, small holders, etc.)
Despite their varying degrees of market understanding and invested capital, all of these entities have a psychological trait that brings them all together.
Indeed, emotionality, the irrational reaction in response to volatility , is a behavior that can be observed repeatedly within this cohort.
Known not to withhold BTC for more than 155 days, STHs have also participated in the fall in the price of bitcoin by agreeing to sell tokens at a price that is less and less attractive.
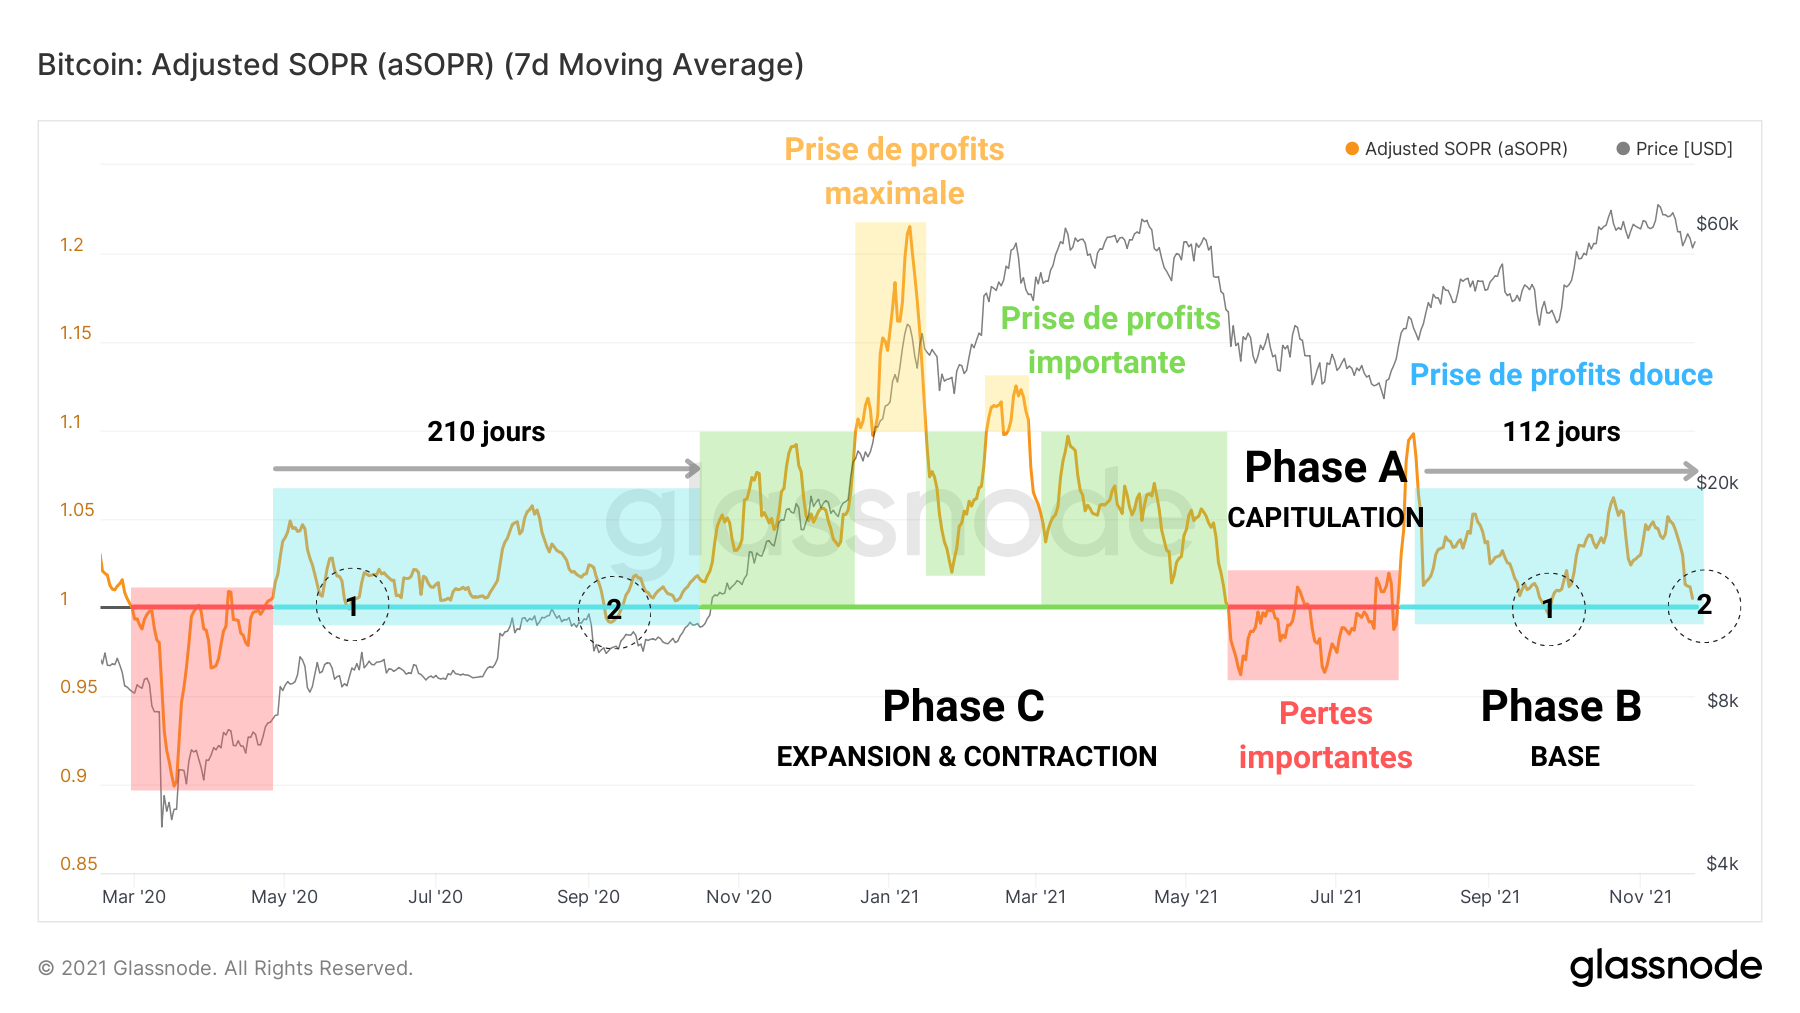
Bitcoin (BTC) aSOPR chart – Source: Glassnode
Highlighted by the aSOPR , the dynamics of the gains made this week indicate a rapid decline in profitability during the correction.
Some STHs literally bought the new ATH before turning their jackets around when they saw the price drop, inducing short-term selling pressure and sending the aSOPR back to its neutral threshold.
To better illustrate this point, let us borrow the analysis tool of Permabull Ni ñ o . By targeting UTxOs that are less than 155 days old , we can deduce their valuation and their realized price.
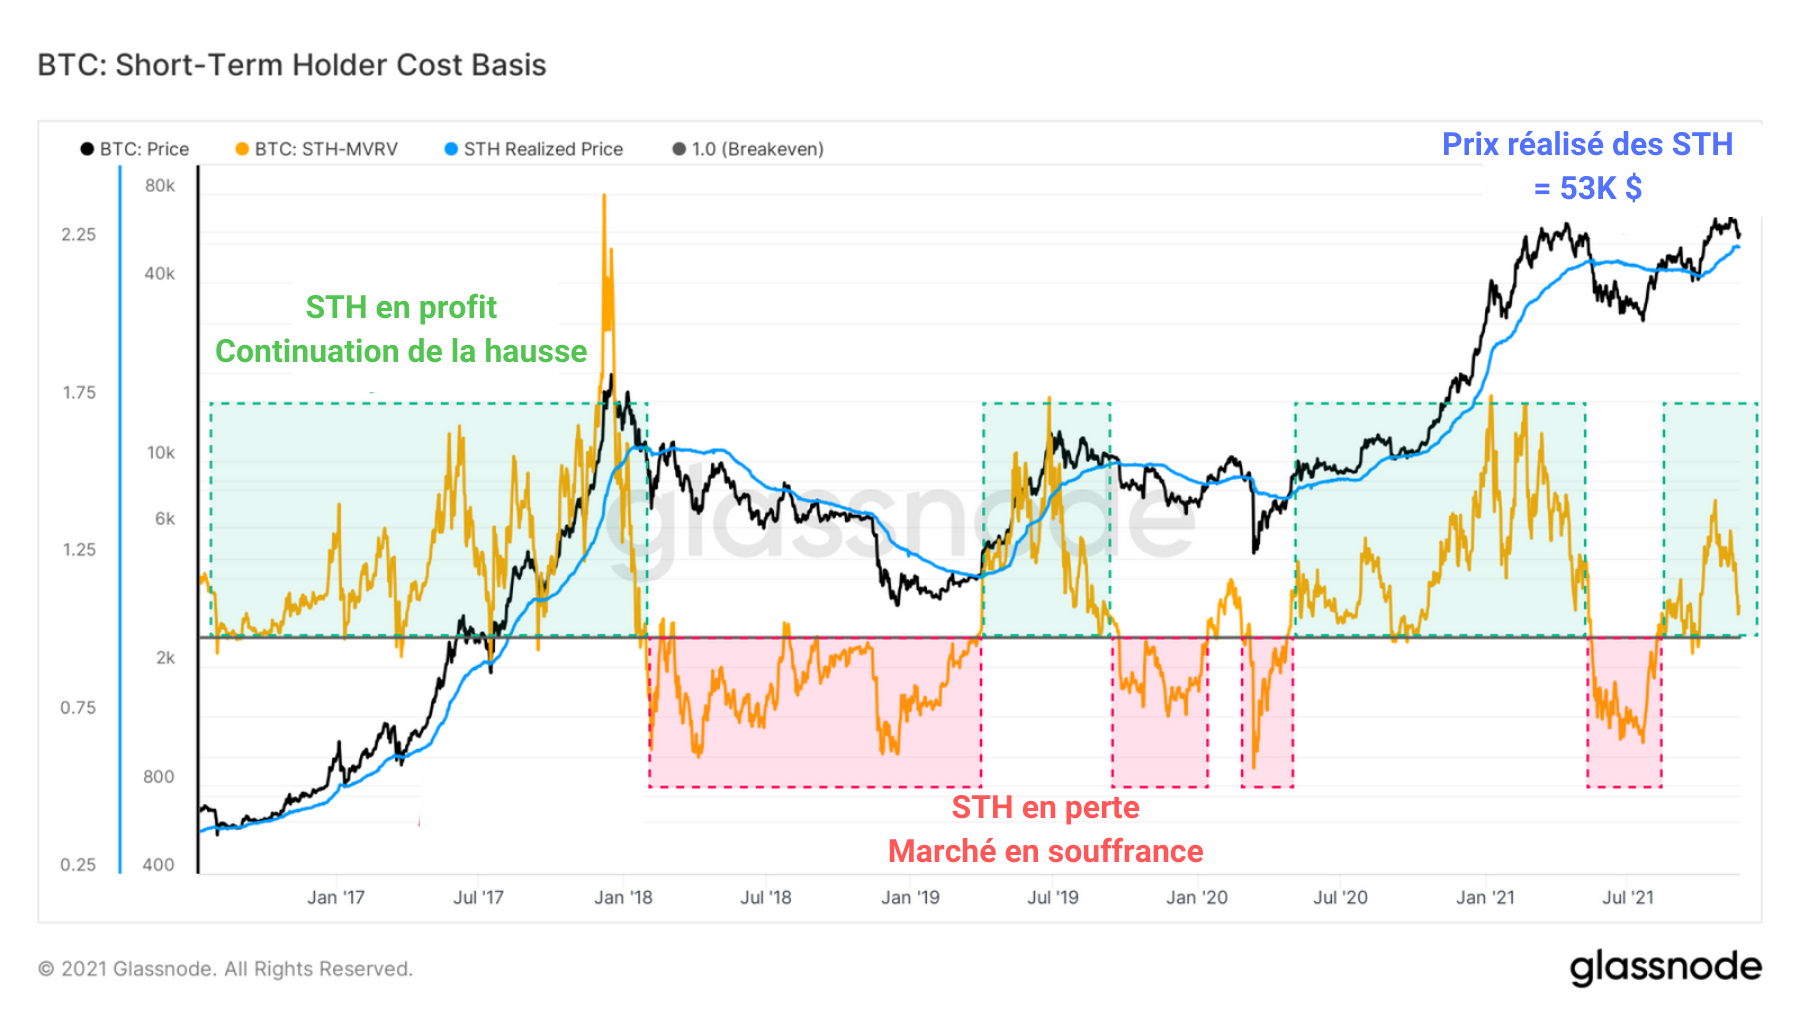
STH-MVRV and STH-rPrice (BTC) chart – Source: Glassnode
What is offered to you is none other than the relationship between the spot price of BTC and the profit index of short-term holders.
The observation is simple, each time the spot price dips below the realized price , the STHs start to sell their tokens at a loss, until reaching a point of maximum pain around a return of -50%.
Conversely, during bullish phases, the spot price is often supported by the realized price during its growth, indicating buying opportunities when the STH-MVRV tests the threshold of neutrality as support.
If such a thing were to happen, the BTC would have to hit $ 53,000 in order to test the base cost of STH and trigger a resumption of the rise or a capitulation of this cohort.
High added value content that is quick to consume
The beginnings of a distribution?
Let us complete this analysis with the addition of a final reading prism, that of long-term holders , or LTH .
After accumulating BTC all summer, some entities in this category have twice spent a moderate amount of tokens at recent highs.
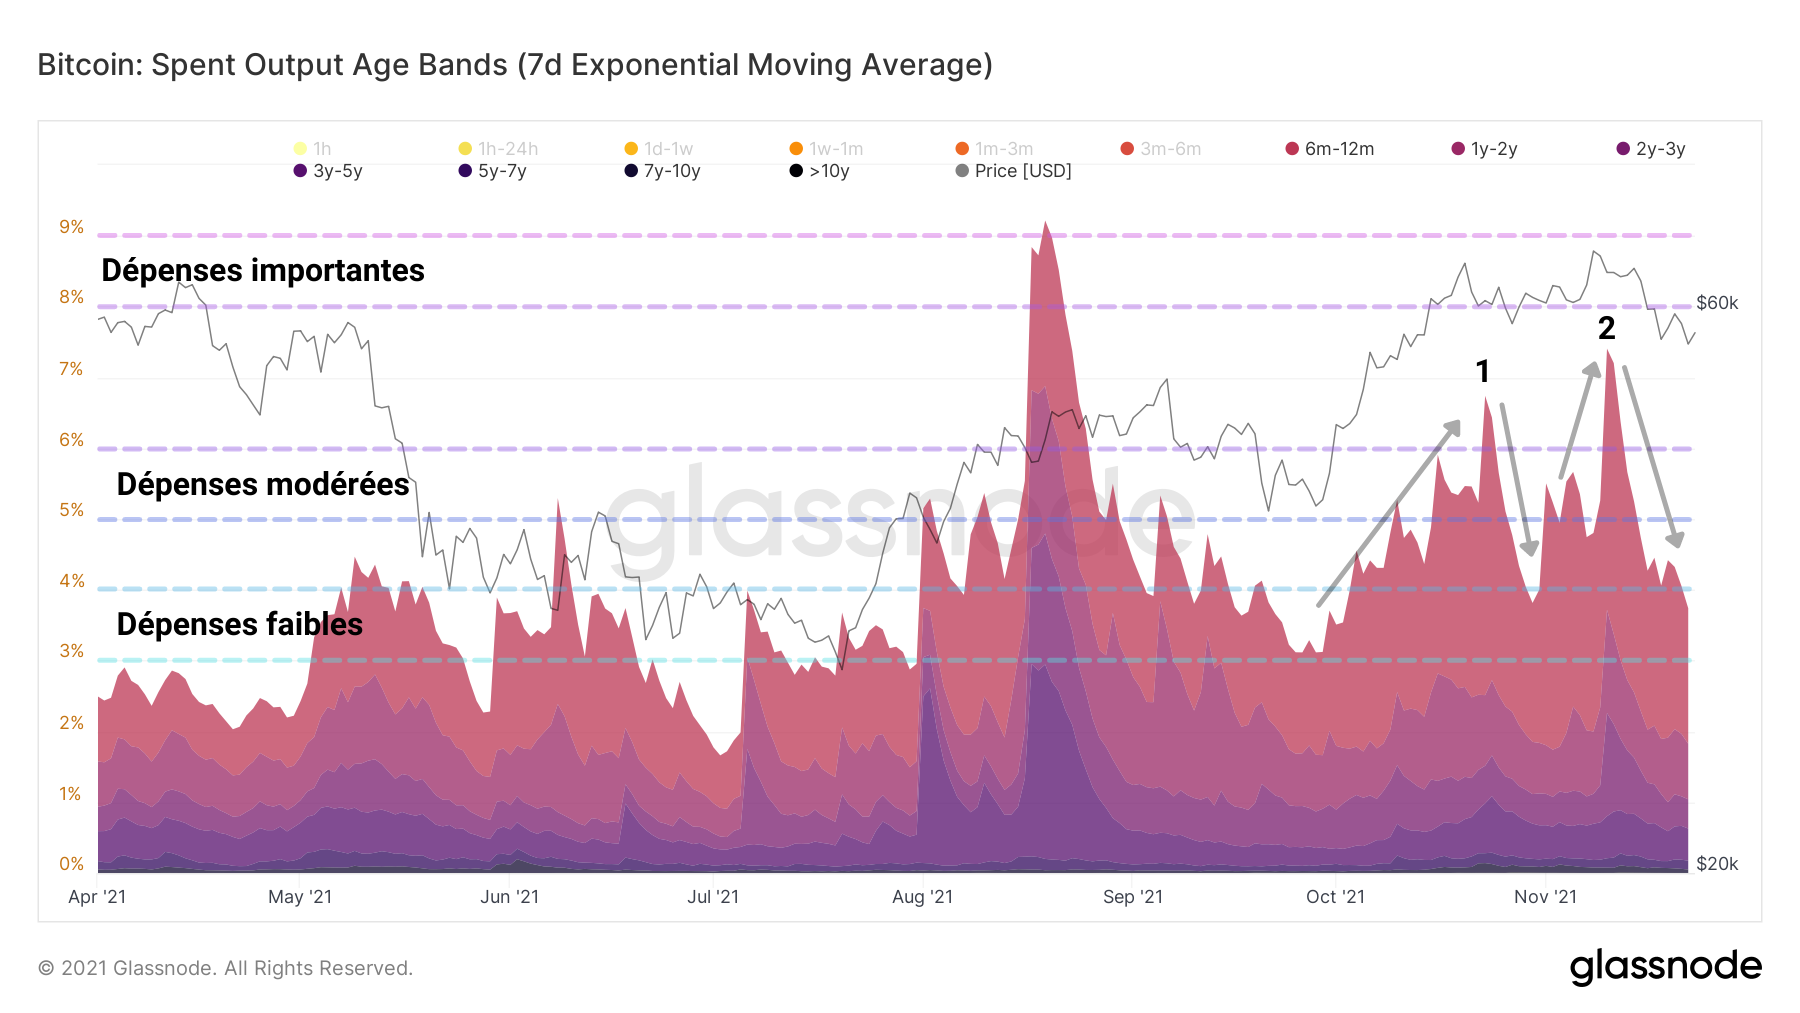
Bitcoin SOAB (BTC) chart – Source: Glassnode
As evidenced by the SVAB , these decreasing volumes signal a rigor of the LTHs which control their selling pressure in order not to break the momentum of the market.
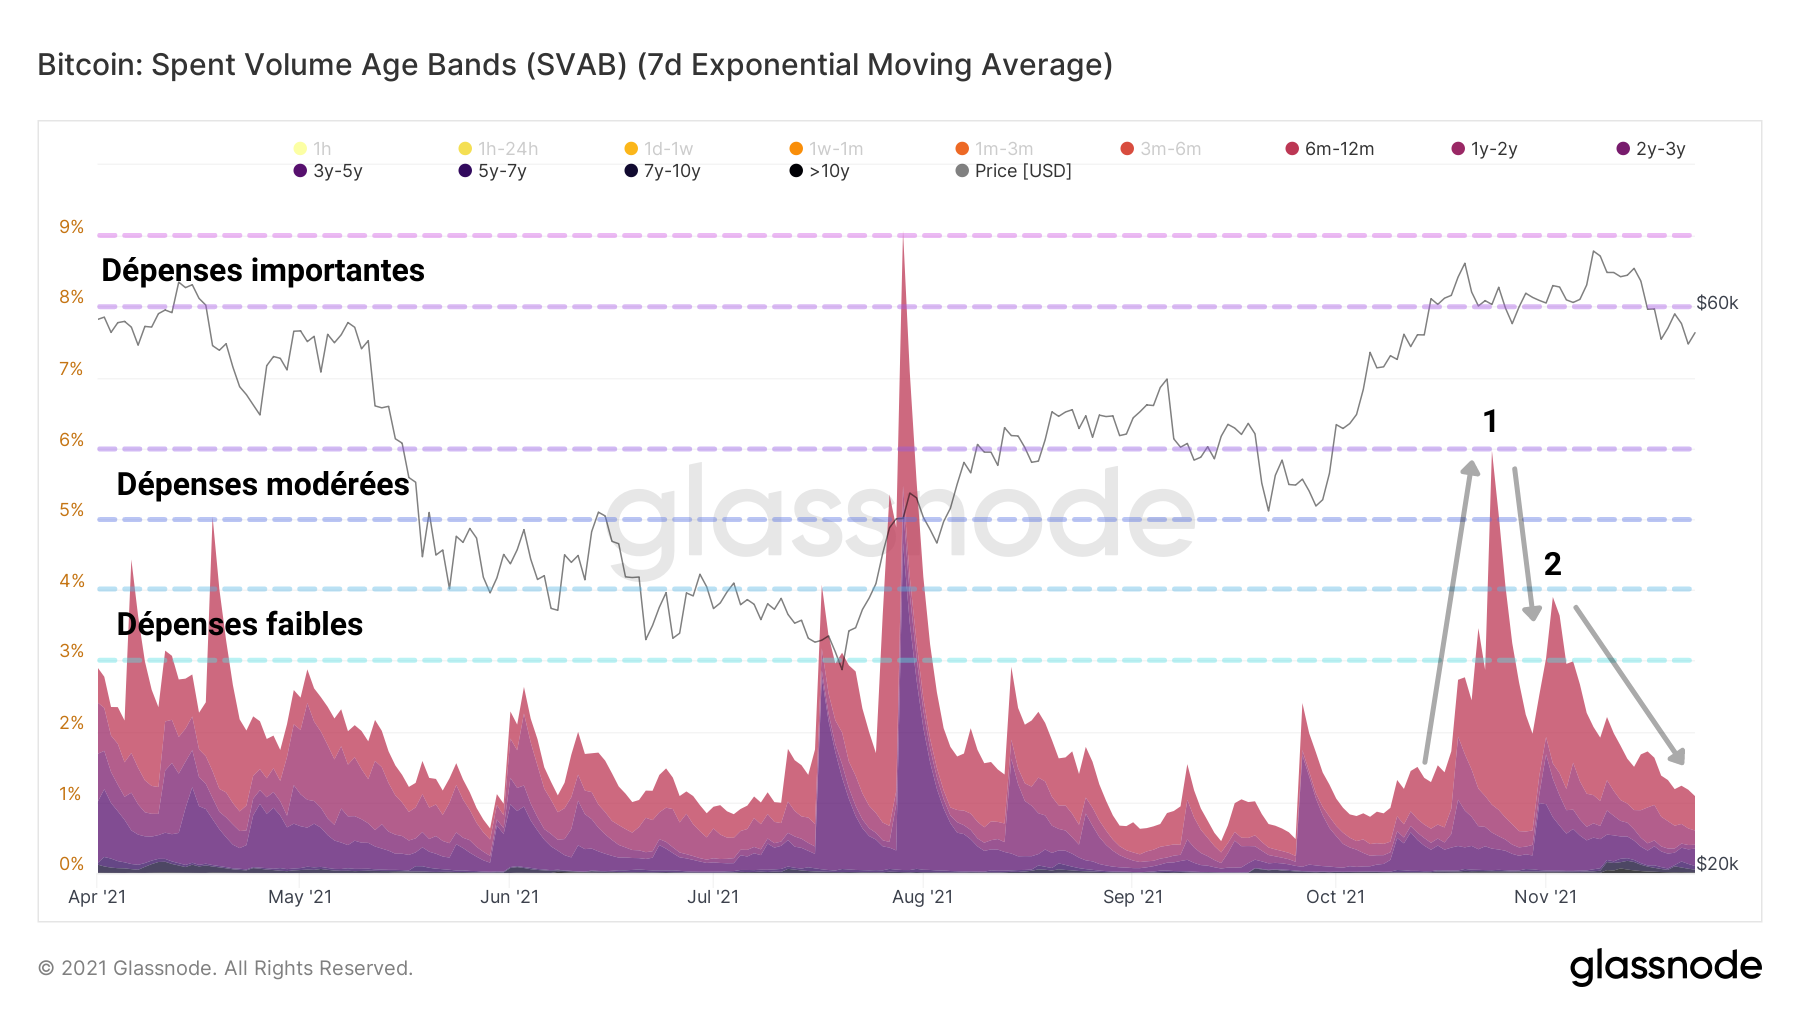
SVAB chart of bitcoin (BTC) – Source: Glassnode
Slowly starting to distribute their tokens at the ATH level, as is customary, these long-term holders bring a touch of liquidity to the market while realizing their gains as they go up.
This cyclical phenomenon is starting to be seen on the bitcoin liveliness chart .
As more and more BTC come out of their dormant state to be reactivated, their Token Days (DD) count is reset to zero.
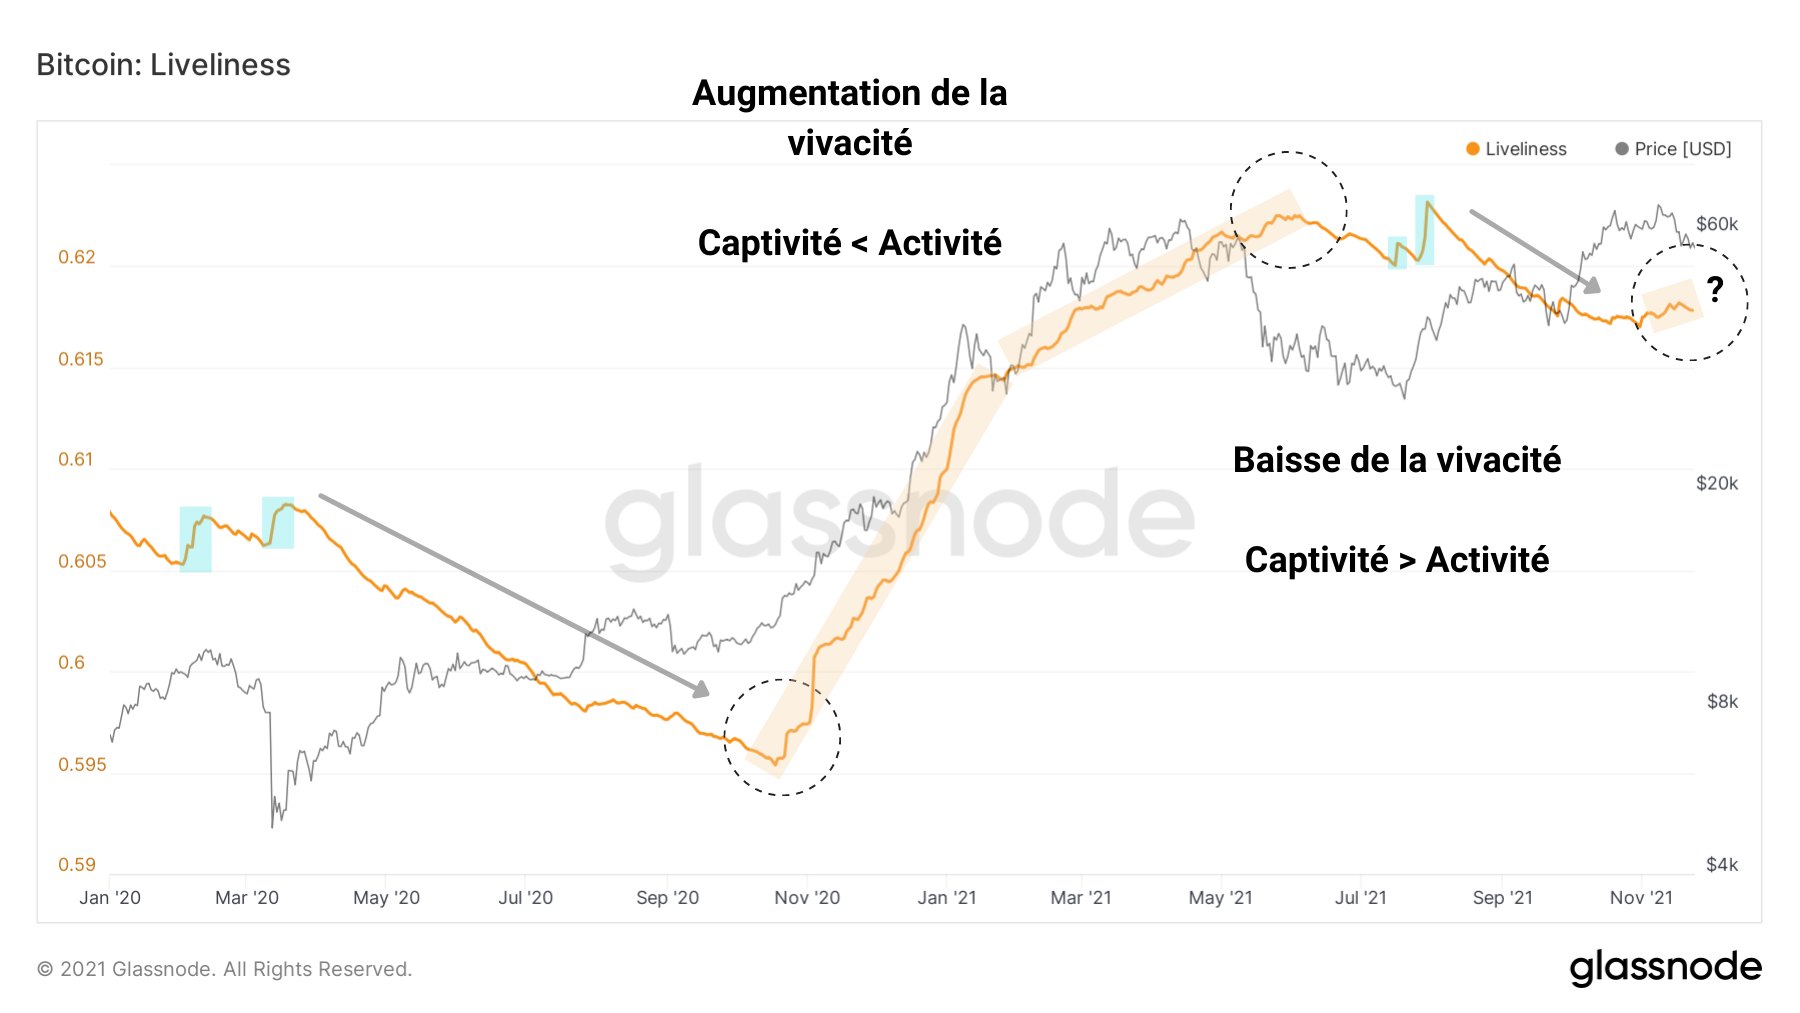
Bitcoin Vividness Chart (BTC) – Source: Glassnode
A destruction of JJ, synonymous with an upturn in economic activity, is looming and bends the curve, initiating a potential trend reversal for this indicator.
Detectable by studying supply dynamics, this captive BTC release process should begin to be identifiable once the supply held by LTHs (blue) is transferred to STHs (pink) in a more sustained fashion.
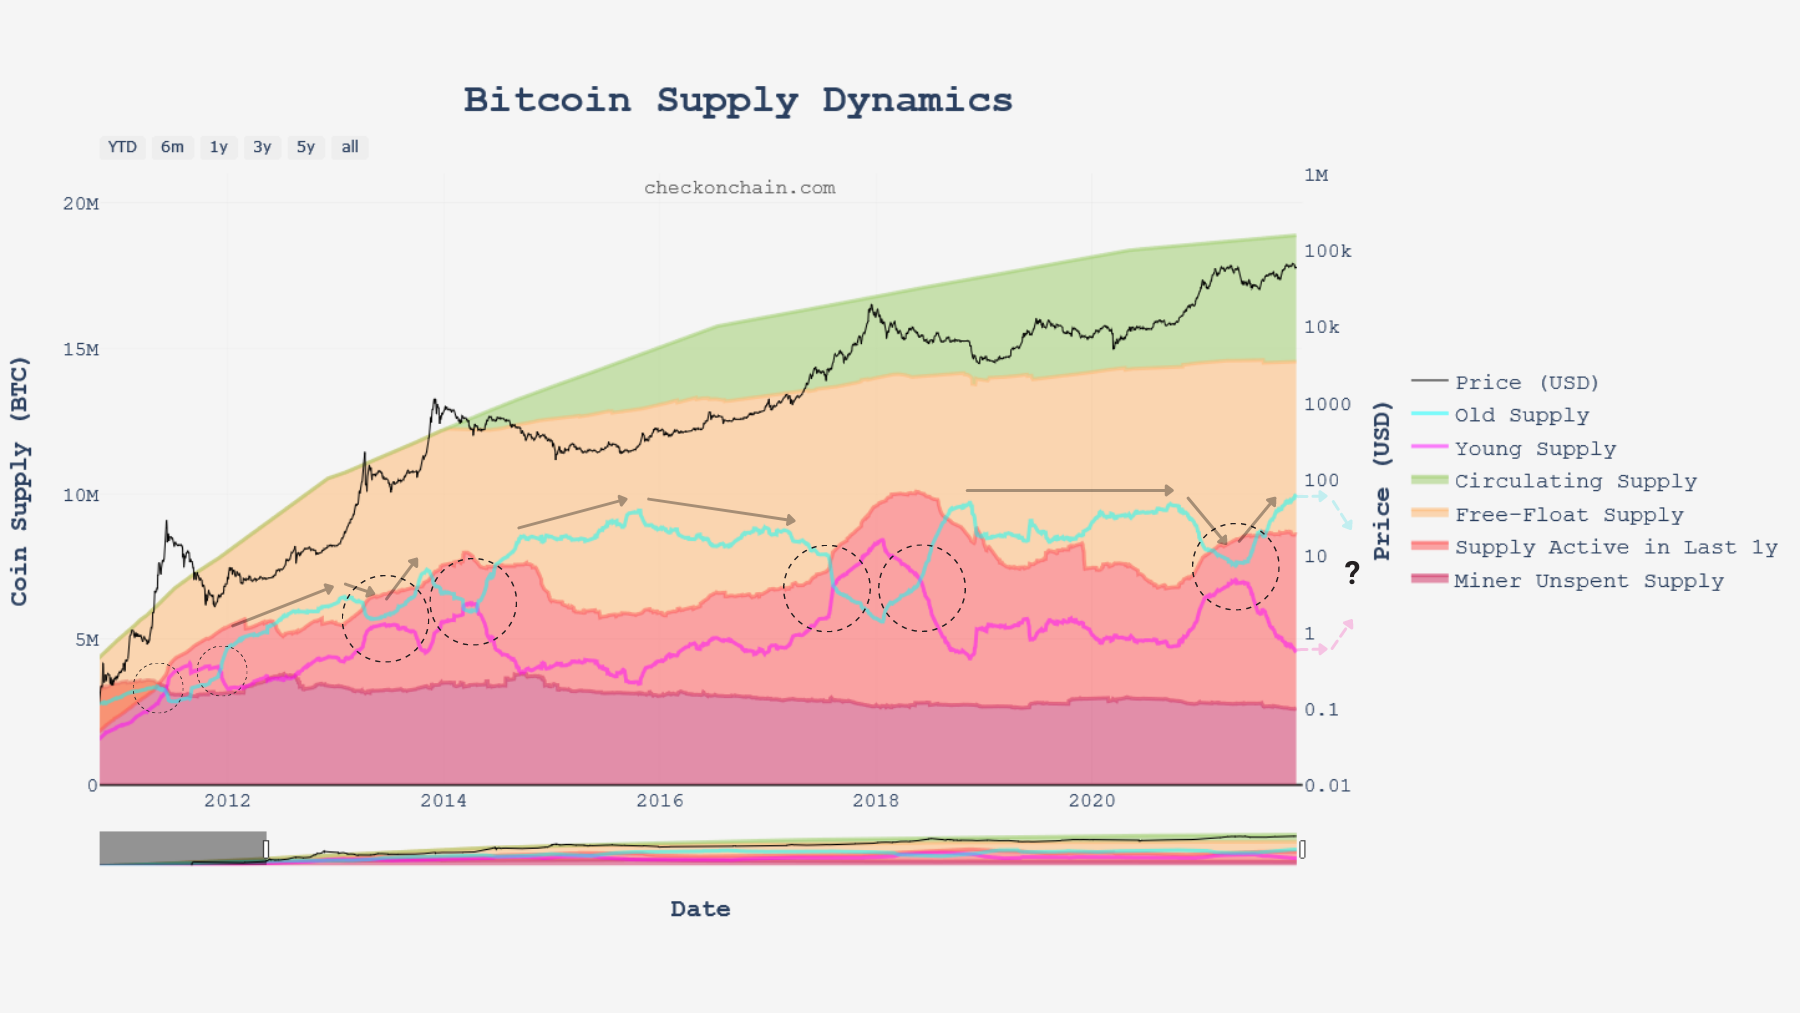
Bitcoin (BTC) supply distribution graph – Source: checkonchain.com
High added value content that is quick to consume
Synthesis
Finally, it seems that the engine of the recent correction is quite nuanced and that the analysis of the past week can be refined by a larger shot.
So, against a backdrop of strong optimism, many STHs appear to have entered a position between $ 53,000 and $ 69,000 , hoping for quick gratification from the market.
Partly taking possession of tokens sold by LTHs near the summit, these entities quickly became disillusioned.
Reselling said tokens in response to the volatility of the correction, STHs then participated in the selling pressure from derivative markets .
To conclude, this week’s study allows us to expand our understanding of the psychology of different cohorts and explain their behaviors within the current market environment.
We can now say that:
- the derivative markets have been purged of excess risk taking;
- the STH were taken aback by the correction in play since November 9;
- the LTH begin gradually distribute their stocks of chips as the price of bitcoin explores new heights.