
Tera TRAINING offers you the UCITS balance sheet for the year 2021, on the occasion of the launch of UCITS indices and sub-indices called TT-CPFI (Tera Training Collective Placement Funds Index) as well as the creation of UCITS indices by management company: TT-FMI (Tera TRAINING Fund Managers Index), in order to accurately measure the performance of aggregate returns for each management company and consequently establish a performance ranking of the best managers. The presentation also covers the evolution of assets under management on the market, the best inflows or outflows by management companies as well as the ranking of the returns of all UCITS in the market.
Synthesis
During the year 2021, the assets of the collective management industry in transferable securities (FCP and SICAV) momentarily crossed the threshold of 5 billion dinars for the first time since 2011, during the months from May to November. . However, in December, the size of assets fell by 326.5 million dinars (-6.4%) following the decline in the assets of bond UCITS by -305.4 million dinars (-6.8%) and mixed UCITS and shares of -21.1 million dinars (-3.2%). Over the year as a whole, the size of UCITS assets increased from 130.1 million dinars (+ 2.8%) to 4,813.4 million dinars following the increase in the assets of bond UCITS. 152.9 million dinars (+ 3.8%) to 4,178.5 million dinars against the decline in the assets of Mixed UCITS & shares from -22.8 million dinars (-3.5%) to 634,9 million dinars.
The size of bond UCITS assets represents 86.8% of all UCITS versus 86% at the end of 2020.
Capitalization-type UCITS assets represent a share of 49.1% compared to 44.3% at the end of 2020. Distribution UCITS account for 50.9% of total assets compared to 55.7% as of December 31, 2020.
Overall the performance of the funds has been positive. Only 10 UCITS out of 68 mixed UCITS and equities posted a negative performance. All of the 45 bond UCITS achieved a positive return.
In bonds, capitalization UCITS outperform distribution-type UCITS. Conversely, mixed funds & distribution equities do better than capitalization funds.
Finally, the UCITS population was enriched in 2021 by the arrival of two new funds: FCP ILBOURSA CEA in June 2021 created at the joint initiative of MAC SA and the media specializing in financial news: ilboursa.com and in August 2021, the ATTIJARI FCP OBLIGATAIRE fund created by Attijari Gestion.
Review of the results of the UCITS industry during the year 2021: workforce, evolution of assets under management, list of the highest inflows and outflows by management company and ranking of the best performances by management companies and by UCITS.
1 Market physiognomy
1.1 Population of UCITS as of December 31, 2021
As of December 31, 2021, the Tunis financial center had 115 UCITS (two of which are in liquidation) against 119 UCITS at the end of 2020. The change in the number of UCITS results from:
- + 2): enrichment of the market with two new UCITS: FCP ILBOURSA CEA in June 2021 and ATTIJARI FCP OBLIGATAIRE in August 2021;
- -2) The close of liquidation on March 31, 2021 of the FCP Maxula STABILITY and FCP INDEX Maxula Funds, which entered into early liquidation on September 25, 2020.
- -2) The liquidation closing on October 6, 2021, of the two UCITS FCP Maxula Croissance Prudence and FCP Maxula Growth Balanced.
- -1) The close of liquidation on August 6, 2021 of the AIRLINES FCP VALEURS CEA Fund managed by Tunisie Valeurs.
- -1): The close of liquidation on December 27, 2021 of the TUNISIAN EQUITY FUND managed by UGFS-NA.
In addition, two funds managed by CGF entered the liquidation phase from October 12, 2021:
- AL AMANAH PRUDENCE FCP, Mixed-category mutual fund, in application of article 15 of the UCITS code (the original value of all the units in circulation remains, for ninety days, less than one hundred thousand dinars);
- TUNISIAN FUNDAMENTAL FUND, Mixed category Mutual Fund, following the expiration of its term.
Note that the BNAC PROGRÈS FCP mixed fund has changed its name to “FCP Progrès Obligataire”, from category to bond and from the original value of 100 dinars to 10 dinars. We will not take these changes into account, as they did not come into effect until December 30, 2021.
Finally, we note that the management company BIAT ASSET MANAGEMENT changed, at the beginning of 2021, its corporate name, which will henceforth be called: TUNISIE VALEURS ASSET MANAGEMENT. From January 3, 2022, the management of the 8 UCITS, previously managed by Tunisie Valeurs, is transferred to TUNISIE VALEURS ASSET MANAGEMENT. Similarly, and from January 3, 2022, the administrative and accounting management of the 8 UCITS originating from Tunisie Valeurs and the 7 UCITS from TUNISIE VALEURS ASSET MANAGEMENT is provided by Tunisie Valeurs. In this document, we kept the distinction between the two structures given that the consolidation of the management of the 15 UCITS within a single entity was only carried out at the end of 2021.
The change in net assets takes into account the 115 existing UCITS. On the other hand, the classification of fund returns, presented in this presentation, refers only to a population of 113 UCITS without taking into account the two UCITS in liquidation, namely: the mixed funds AL AMANAH PRUDENCE FCP and TUNISIAN FUNDAMENTAL FUND managed by CGF.
1.2 Evolution of the size of UCITS assets in 2021
After three successive years of decline (2017-2018-2019), the size of assets initially strengthened in 2020 by 27.4% (+1008.7 million dinars), totaling 4,683.3 million dinars then by 2.8% (+130.1 million dinars) in 2021 to 4,813.4 million dinars. The historical record dates back to 2011, with total UCITS assets of 5.245 billion dinars.
The improvement in the outstanding amount of UCITS during the year 2021 is mainly attributed to bond UCITS (+152.9 million dinars, or + 3.8%) against a decrease in the outstanding amount of mixed UCITS and shares (- 22.8 million dinars, or -3.5%). The bond UCITS accumulated until November 2021, assets increasing YTD by 11.4%, however in December, a strong outflow of 305.4 million dinars slowed down the increase in assets on the whole. of the year.
The contraction of Mixed UCITS and equities occurred mainly in January, June, October and December of the current year.
At constant scope (excluding UCITS liquidated or in the process of liquidation but taking into account the new UCITS created), the size of assets increased by 3.0% (+138 million dinars) to stand at 4,807.7 million dinars.
The size of assets under management including UCITS active between the end of 2020 and 2021 increased by 128.3 million dinars from 4,679.4 million dinars to 4,807.7 million dinars. This amount corresponds to the actual collection from the management companies (including the price effect of the NAV).
1.3 Largest 2021 collections / withdrawals by management company
The increase in UCITS assets between December 2020 and December 2021, amounting to 128.3 million dinars, is due to a positive inflow of 362.4 million dinars from 14 management structures and an outflow. of 234.1 million dinars for the 13 other management companies.
Mac SA was the management company which increased its assets the most with an increase of 204.8 million dinars, or + 67.6%. An increase mainly attributed to the strengthening of the assets of FIDELITY SICAV PLUS by +232.9 million dinars.
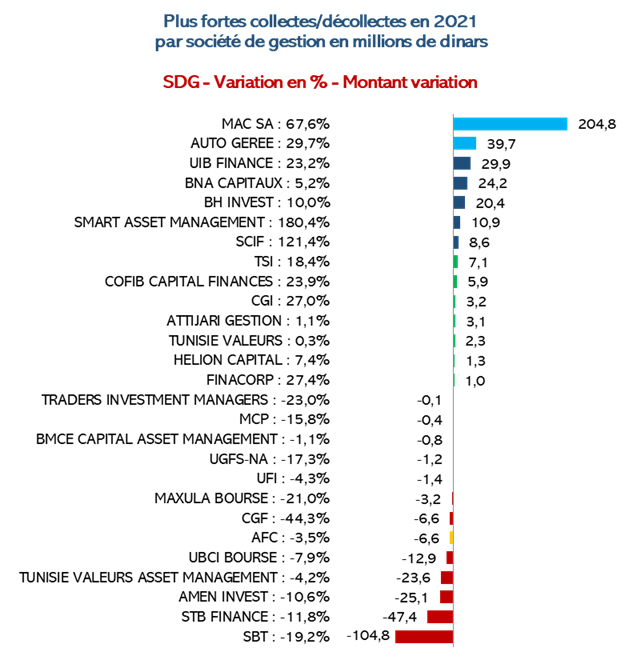
In second position, the SICAV (Self-managed) of the BTE: TUNISO-EMIRATIE SICAV improves its assets by 39.7 million dinars (+ 29.7%). Just behind, it is UIB Finance which monopolizes the third step of the podium, whose asset size has appreciated from 29.9 million dinars (+ 23.2%) to 158.4 million dinars following the increase. the assets of the only UCITS it manages, namely: INTERNATIONALE OBLIGATAIRE SICAV.
Note also the increase in assets under management of BNA Capitaux (+24.2 million dinars), BH Invest (+20.4 million dinars), and Smart Asset Management (+10.9 million dinars).
In contrast, the SBT (Société de Bourse de Tunisie) achieved the largest drop in assets under management (-104.8 million dinars) following the collapse of SICAV assets RENDEMENT of -111 million dinars. STB FINANCE also saw its assets contract by -47.4 million dinars (-11.8%) following the contraction of the assets of SICAV L’ÉPARGNANT (bond) by -38.5 million dinars.
In relative terms, the distinction goes to Smart Asset Management which has improved (not taking into account liquidated UCITS) the size of its assets from 180.4% to 17 million dinars.
1.4 Classification of management companies by size of outstanding UCITS assets
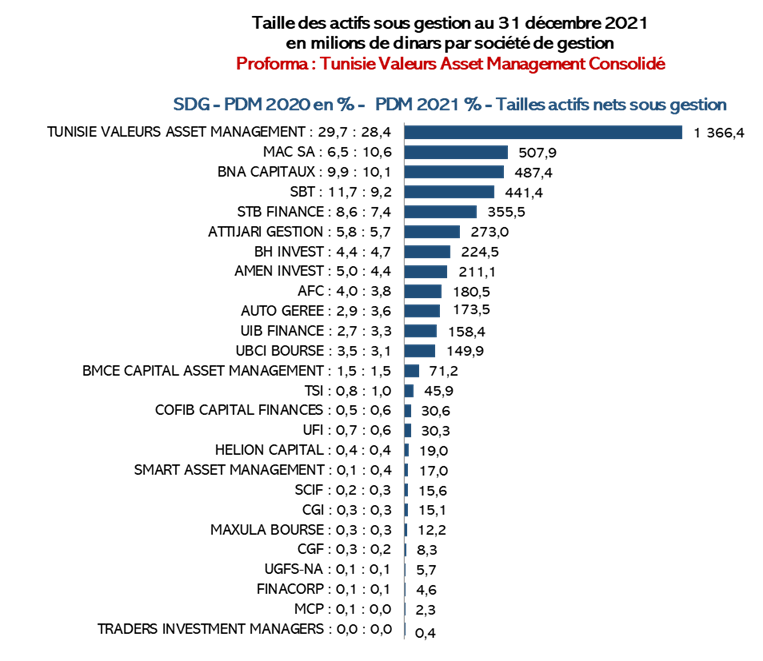
By management structure (stock exchange intermediary or management company or self-managed), no change in the ranking of the first two compared to that of December 31, 2020. Tunisie Valeurs retains its leadership with the largest market share in the December 31, 2021: 17.2% (compared to 17.6% at the end of 2020) of assets under management of market mutual funds.
As of December 31, 2021, Tunisie Valeurs manages an envelope of 825.1 million dinars (including 664.6 million dinars of assets accruing to TUNISIA SICAV) against 822.8 million dinars at the end of 2020 (and 817.8 million dinars dinars in 2020, at constant scope: excluding AIRLINES FCP VALEURS CEA liquidated).
In second position, Tunisie Valeurs Asset Management covers assets of 541.3 million dinars (including 288.7 and 139.9 million dinars respectively of SICAV PATRIMOINE OBLIGATAIRE and SICAV TRESOR), against 564.8 million dinars despite the end of 2020 , i.e. a market share of 11.3% compared to 12.1% in 2020.
Of the seven UCITS managed by Tunisie Valeurs Asset Management, only FCP BIAT-EPARGNE ACTIONS recorded a positive change in its assets (+6.3 million dinars), while the assets of SICAV OPPORTUNITY remained at the same level.
Behind the two market leaders, the ranking has undergone significant changes: SBT from 3 rd to 5 th , against the rise of MAC SA to 3 rd position, while BNA retains its 4 th position.
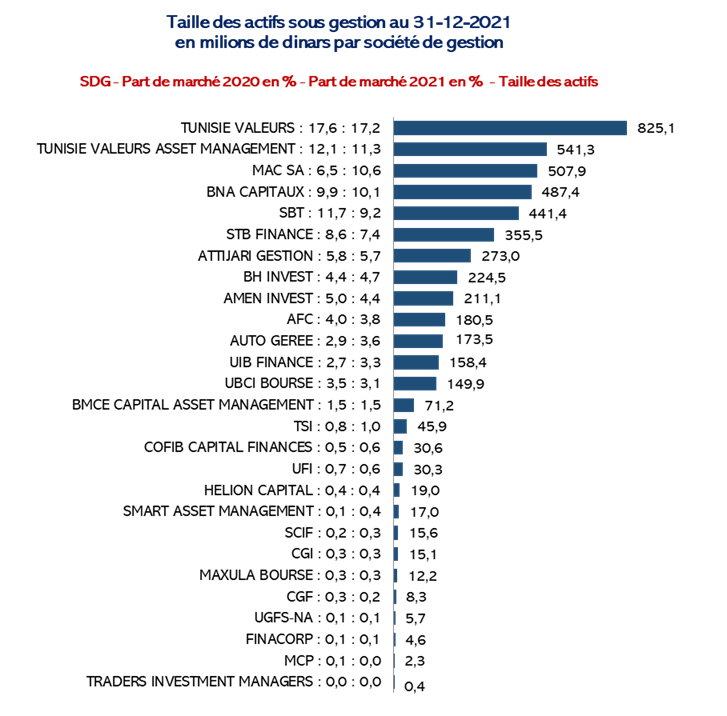
In Proforma, the cumulative assets under management of TUNISIE Valeurs and Tunisie Valeurs Asset Management amounted at the end of 2021 to 1366.4 million dinars against 1387.7 million dinars at the end of 2020, i.e. a market share of 28.4%. against 29.7% at the end of 2020.
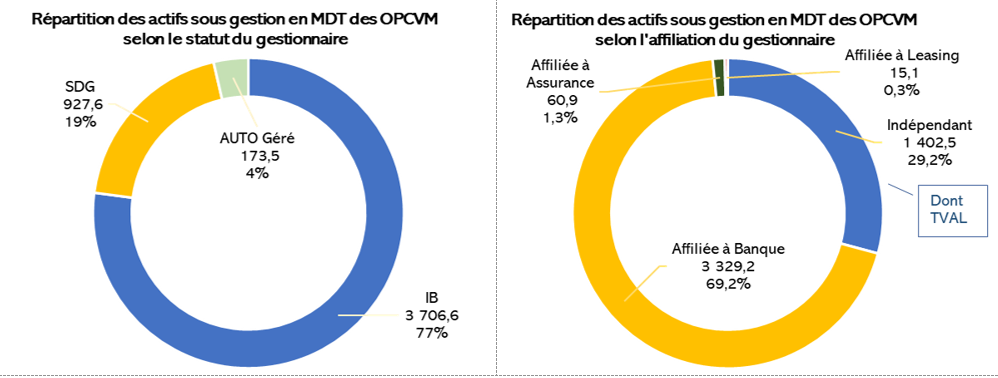
1.5 Breakdown of assets under management according to the status and affiliation of the manager
Despite being taken over by BIAT, “Tunisie Valeurs” will remain this year classified as an independent manager (not affiliated with a bank) given that its current commercial assets (clients and assets under management) were created before it was transferred to the scope of BIAT.
2 Performance of the UCITS TT-CPFI indices
The company Tera TRAINING has created a family of monthly UCITS index with base 1000 on December 31, 2017. These indices called: TT-CPFI (Tera TRAINING Collective Placement Funds Index) measure the performance (capitalized dividends) of the returns of UCITS weighted by their size while neutralizing the effect, subscription / redemption on a monthly basis (adjustment of the net assets of the previous month). Tera TRAINING also produces sub-indices broken down according to the UCITS category, according to the management orientation with the possibility of segregation each time by type (capitalization or distribution).
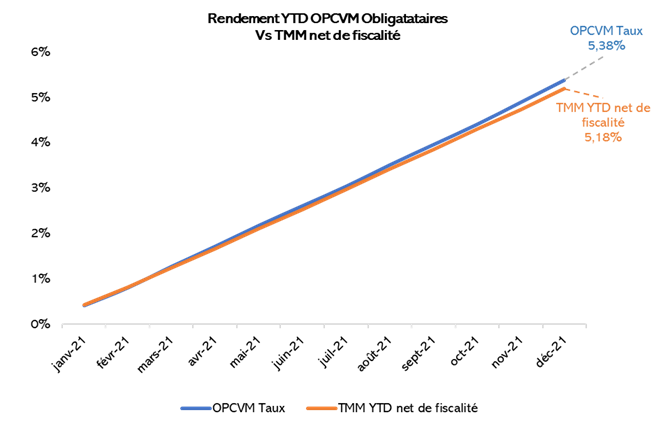
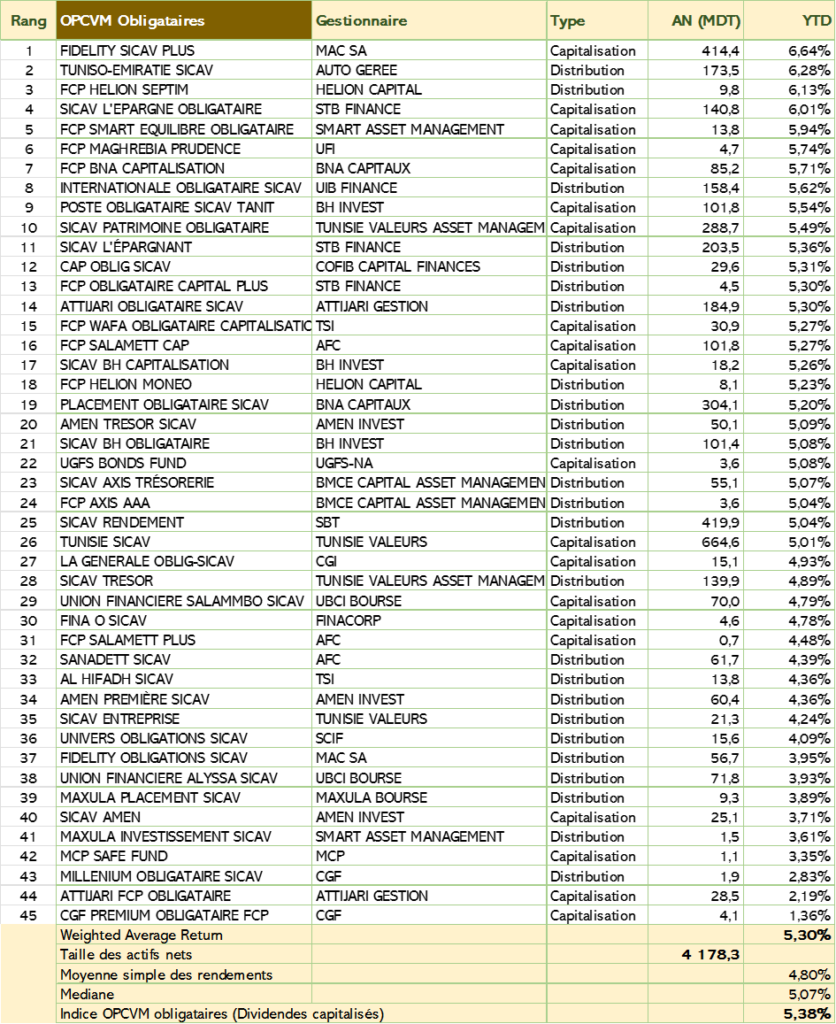
Thus, the bond UCITS index (rate) recorded in 2021 an overall performance of 5.38%, slightly outperforming the TMM YTD index (net of tax), whose performance amounted to 5.18%.
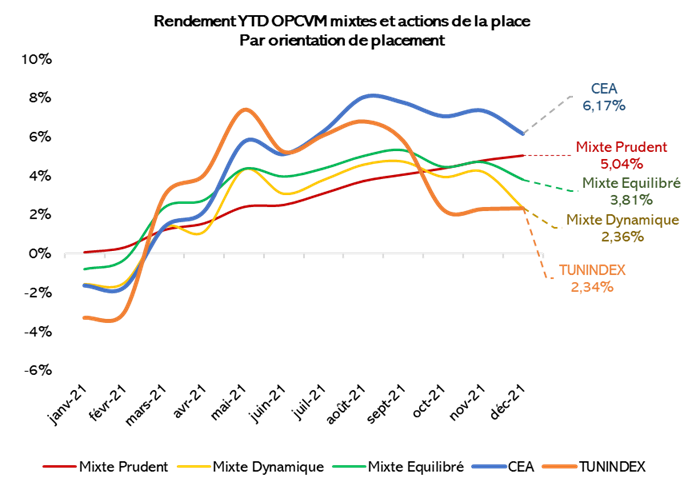
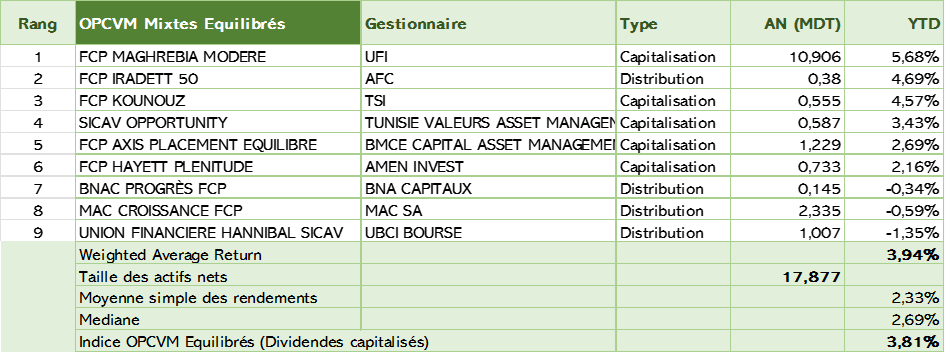
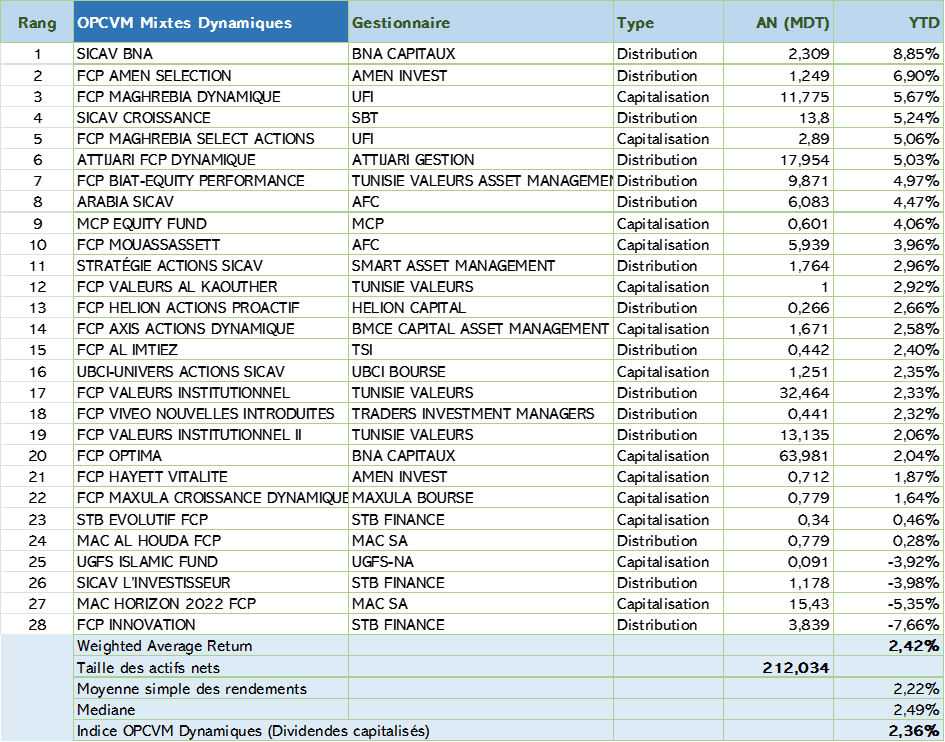
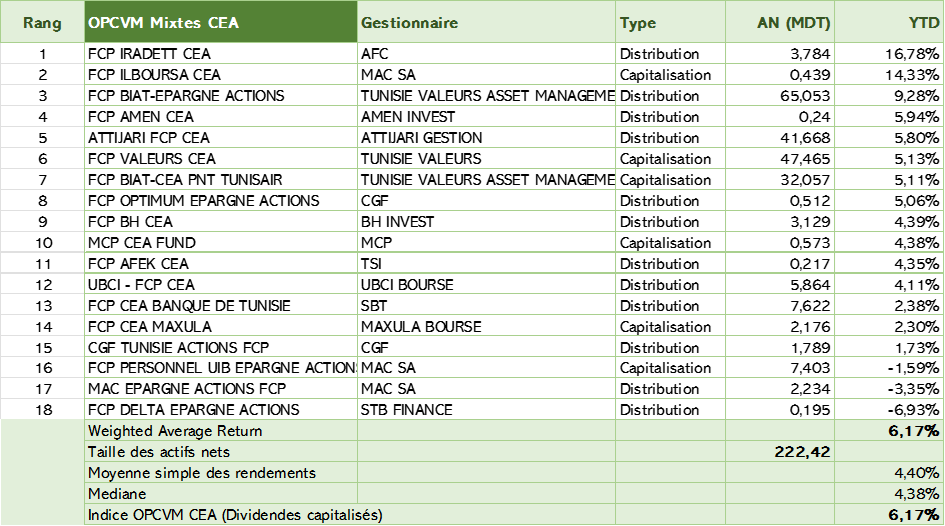
For mixed funds and equities, the performance was globally positive and superior to that of TUNINDEX. The CEA UCITS index stands out with a yield of 6.17%, followed by Prudent mixed UCITS with a return of 5.04%, then balanced mixed UCITS with 3.81% and finally dynamic mixed UCITS with 2, 36%.
3 Ranking of Management Companies by performance of returns
The creation of the TT-FMI indices (Tera TRAINING Fund Managers Index) makes it possible to give a faithful estimate of the cumulative performance of funds managed by the same management structure. Each UCITS contributes up to its size within the same management company. TT-FMI calculates the weighted average performance with monthly frequency of the UCITS of the 26 management companies. Each management company is assigned a TT-FMI index.
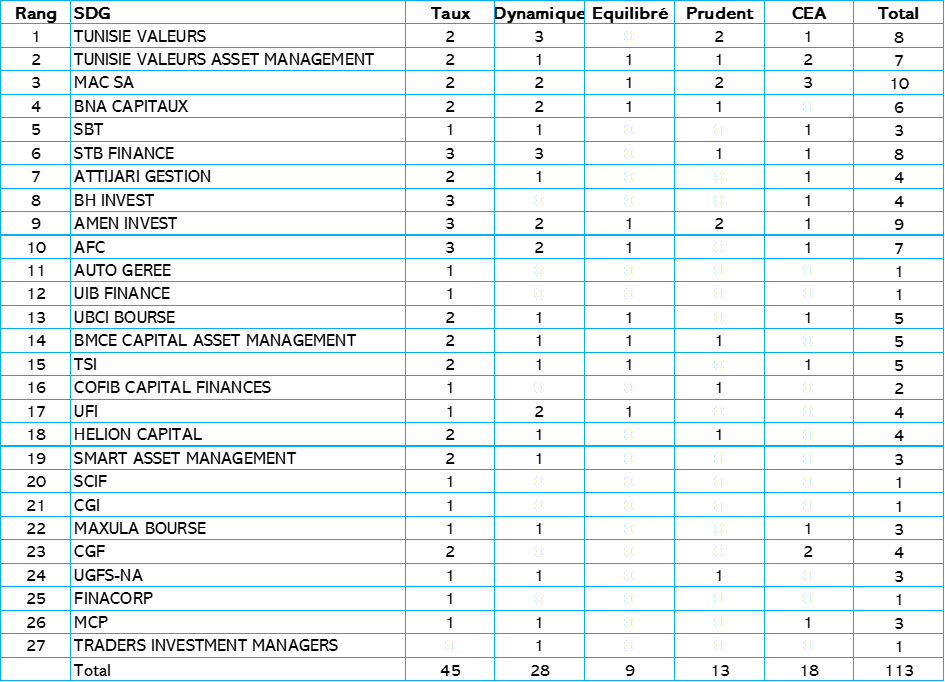
3.1 Population of UCITS Vs Management companies
It should be noted that in a bull market, companies which manage a lot more (or than) dynamic funds or CEA will have an advantage over companies which only manage bond or prudent funds and vice versa. For bond UCITS, the small size of the fund can help achieve higher returns compared to larger funds.
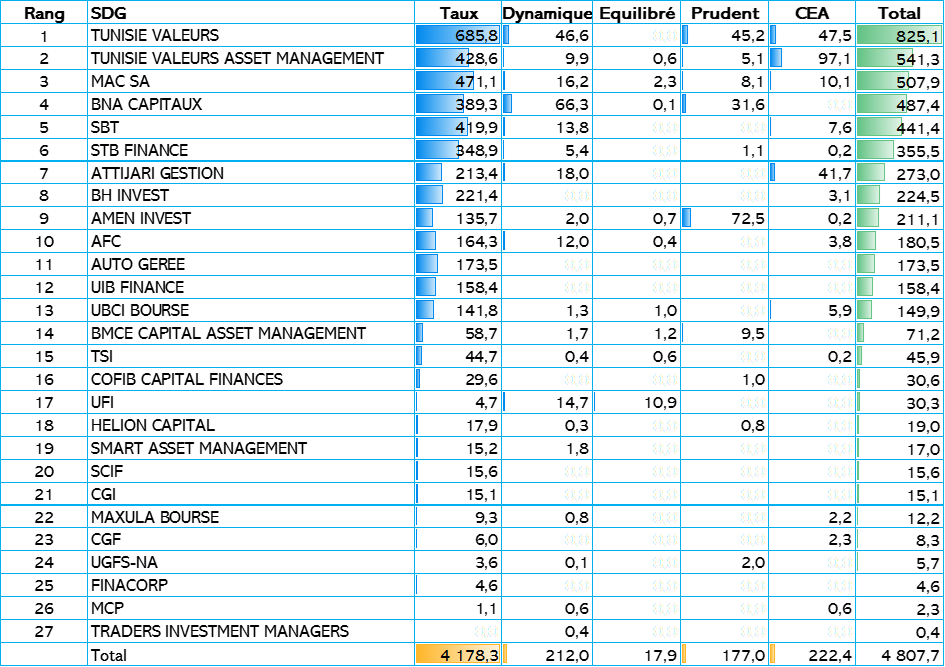
3.2 Net assets under management by management companies and management orientation of UCITS
Bond UCITS dominate the face of the Tunisian market
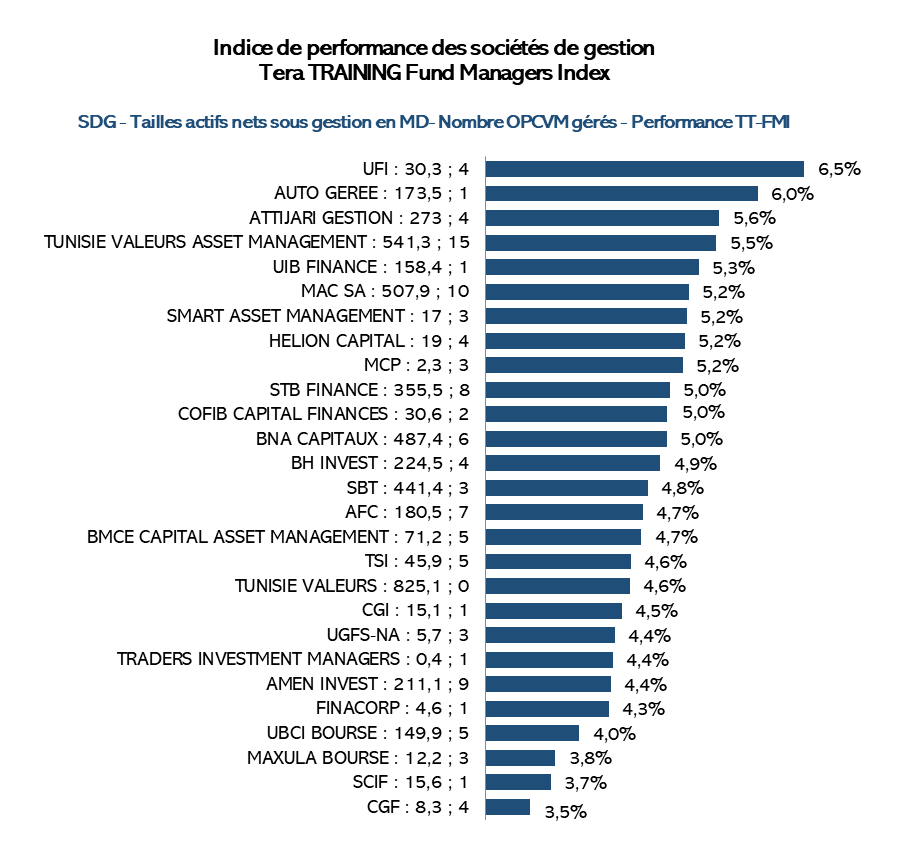
3.3 SDG classification (TT-IMF)
With four UCITS managed, including one bond, Union Financière posted, in 2021, the best average performance (TT-FMI) of its funds of 6.5% and thus ranks first in the ranking of the best management companies for 2021. The size of the assets of UCITS managed by Union Financière amounts to 30.3 million dinars on December 31, 2021.
The only self-managed SICAV, TUNISO-EMIRATIE SICAV, is in second place in the ranking with a performance of 6.0%.
With four funds under management of which two bond Attijari management loop the 3 rd step of the podium with an average performance of 5.6%.
4 Ranking of Tunisian mutual funds by management orientation
The CEA UCITS group achieved the best return with a performance of 6.17% as of December 31, 2021, followed by the bond UCITS group (5.38%).
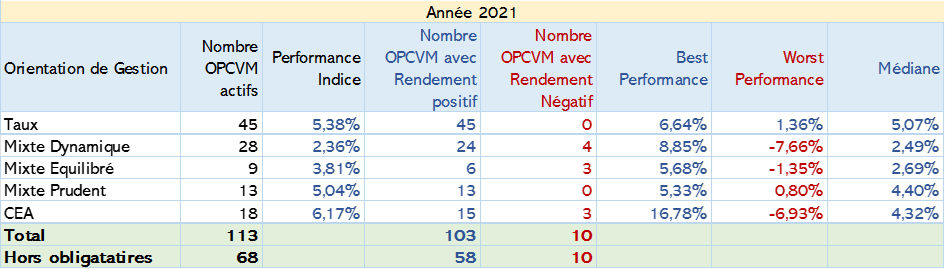
Of the 69 Mixed and / or Equity UCITS, in operation as of December 31, 2021, 58 posted a positive performance against 10 in negative territory. The best performance was achieved by a CEA fund with a yield of 16.78%. The strongest underperformance was -7.67%, also recorded by a dynamic mixed fund.
4.1 Bond UCITS
Borrowing in the footsteps of the year 2020, FCP HELION SEPTIM, FIDELITY SICAV PLUS and TUNISO-EMIRATIE SICAV retain their podium, however FIDELITY SICAV PLUS takes first place at FCP HELION SEPTIM. As for TUNISO-EMIRATIE SICAV, it retains its position of challenger.
SICAV L’EPARGNE OBLIGATAIRE takes fourth place, followed by FCP SMART EQUILIBRE OBLIGATAIRE.
FCP SMART EQUILIBRE OBLIGATAIRE, managed by Smart Asset Management, is a fund which changed since the beginning of the year its category from mixed to bond and its name from “FCP SMART EQUILIBRE” to “FCP SMART EQUILIBRE OBLIGATAIRE”.
4.2 Cautious Mixed UCITS
In this category, it is the “FCP VALEURS MIXTES” fund of Tunisie Valeurs which takes the lead with a yield of 5.33%, closely followed by AMEN ALLIANCE SICAV managed by Amen Invest and FCP SECURITE by BNA CAPITAUX.
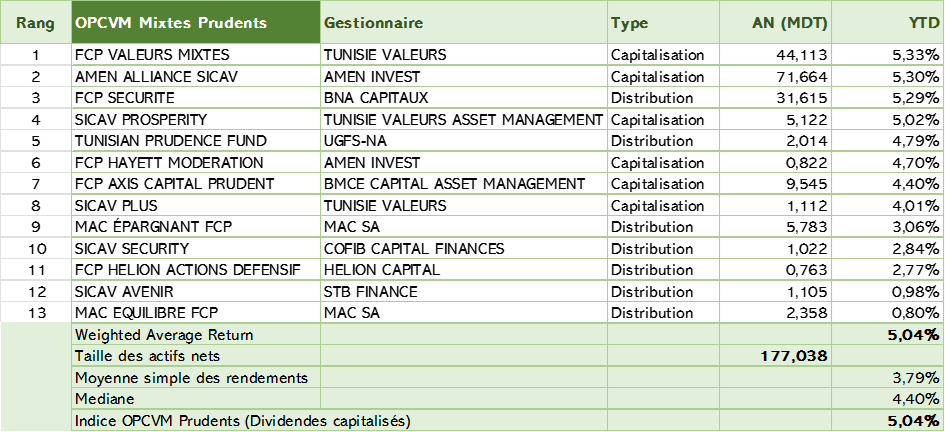
Of the 13 prudent Mixed UCITS, none posted a negative performance.
4.3 Mixed Balanced UCITS
In this group, the best performance is attributed to FCP MAGHREBIA MODERE, managed by the UFI (Union Financière), with a yield of 5.68%. Just behind, FCP IRADETT 50 managed by AFC posted a yield of 4.69%. Finally FCP KOUNOUZ, managed by TSI, closed the podium of the top three of this group with a performance of 4.57%.
4.4 Dynamic mixed UCITS
In this category, the distinction goes to SICAV BNA thanks to a performance of 8.85%. FCP AMEN SELECTION managed by Amen Invest comes in second position with a yield of 6.90%
FCP MAGHREBIA DYNAMIQUE managed by the UFI finished the third step of the Podium thanks to a performance of 5.67%. In this group made up of 28 UCITS, four of them recorded a negative variation, the worst of which is -7.66%, which is also the worst performance of any category of funds combined.
4.5 CEA Fund
In this group, the FCP IRADETT CEA fund, managed by AFC, has the best performance thanks to a return of 16.78%, ie the best performance in all categories. FCP ILBOURSA CEA managed by Mac SA takes the second position as well as the second best yield (14.33%) all categories of UCITS. Finally, FCP BIAT-EPARGNE ACTIONS managed by TUNISIE VALEURS ASSET MANAGEMENT finished the Top 3 podium with a return of 9.28%.
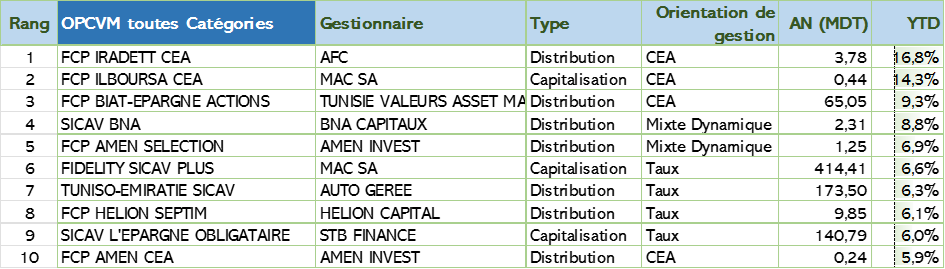
4.6 Top 10 best performances of UCITS, all fund categories combined
The Top 5 for the best performances of the year 2021, all fund categories combined, is awarded to two UCITS with a dynamic management orientation, and three CEA UCITS.
Then, four bond UCITS take positions from 6th to 9th. Finally, a CEA fund finished the Top 10 podium.
NB: All the figures relating to UCITS presented in this paper are extracted or compiled from CMF data and statistics.
Tera Training is a private vocational training company founded by Moez HADIDANE in December 2020. Tera Training is approved by the Ministry of Employment and Vocational Training, Registration number: 11-2052-21.
Tera Training is a management consulting and training firm specializing in corporate finance market finance economic analyzes. Its mission is to support businesses and administrations by providing them with an effective response to their training and skills development needs.
TERA TRAINING
Moez Hadidanefinance , UCITS , Tunisia