
Bitcoin (BTC) is on its way up again, Ether (ETH) seems to want to change its trend, and Avalanche (AVAX) is ready for another phase of expansion. Today, we take stock!
Bitcoin Technical Analysis (BTC)
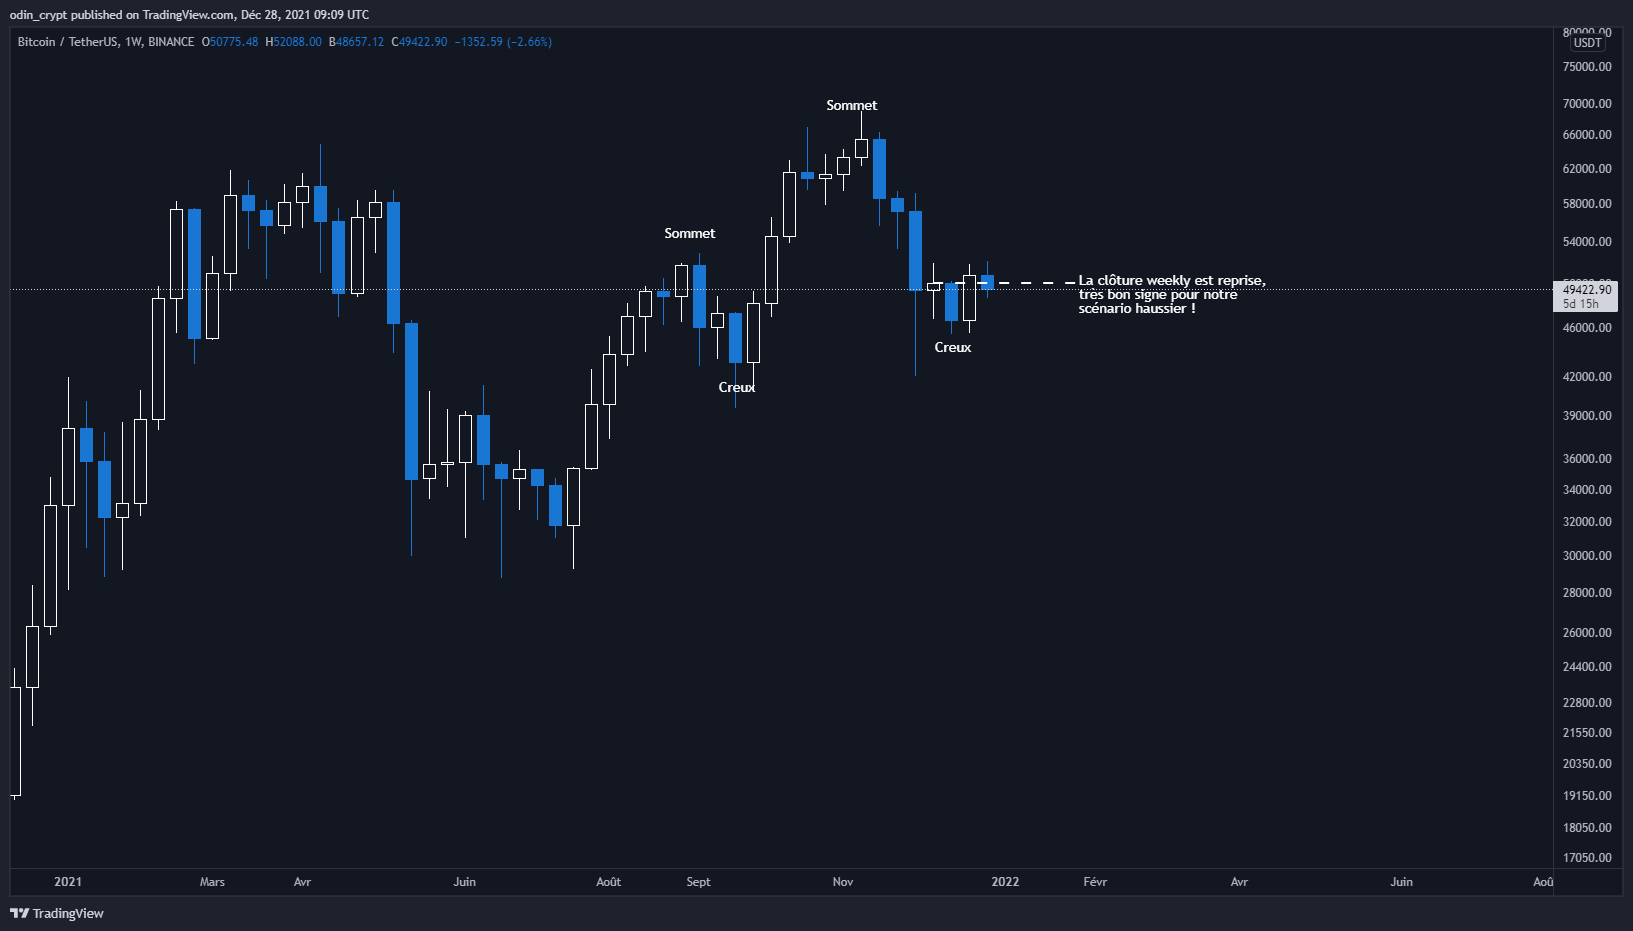
Let’s start with Bitcoin (BTC) , which gave us a nice gift for these holiday season. Indeed, Sunday’s weekly close was above the $ 50,100 level . This level was a first step to restart the uptrend . He was part of the first roadblock in the long climb that awaits us (a resistance).
The higher-than-previous dip theory on macro structure is likely to materialize now, but we will still need to regain some important local levels .
Bitcoin (BTC) analysis in 1W
Let’s zoom in on the daily view to further clarify our analysis.
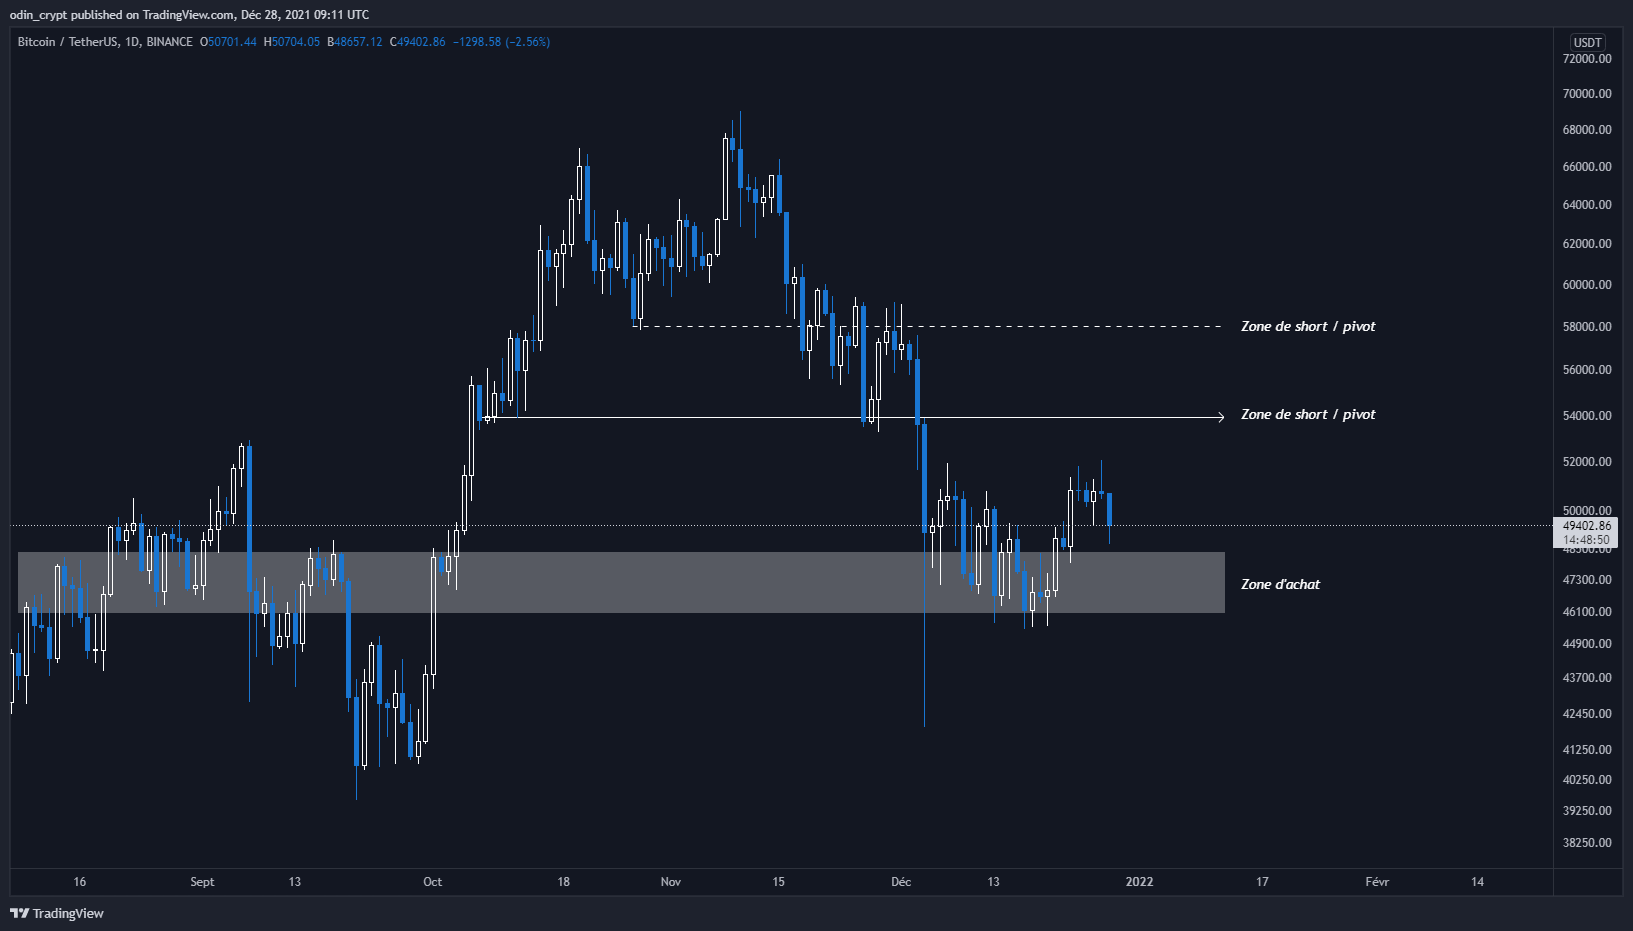
The area identified in the past weeks is still valid and will play a crucial role.
As a reminder :
- The buy zone is always between $ 46,000 – $ 48,300
- The first zone of shorts is $ 53,900 , regaining it would take us to the next one
- The last important zone is at 58 000 $ , if this last one is taken again I expect a new ATH
However, this unit of time only gives us a medium-term indication of the situation. I therefore find it interesting to zoom in further to refine our strategy.
Bitcoin (BTC) analysis in 1D
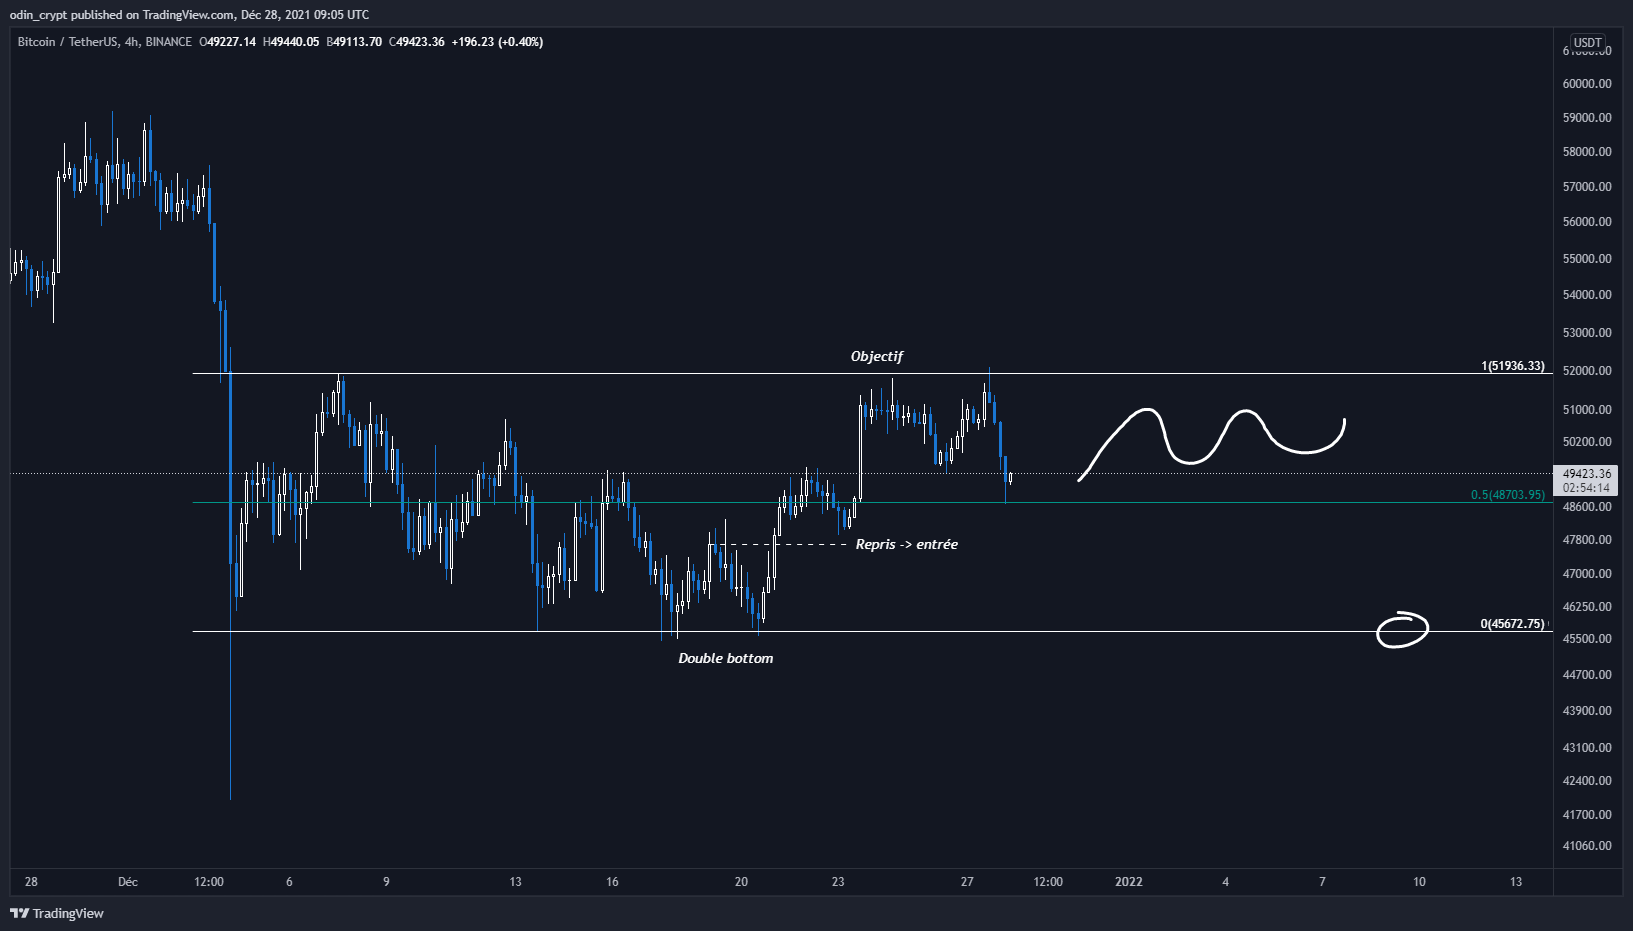
The 4h view gives us important information to be able to position ourselves. We notice that the phase of lateralization ( range ) that we had identified plays its role perfectly. Indeed, the bottom of the range allowed the price to a scenario in double dip ( double bottom ).
He also achieved (for Christmas) the identified goal. The top of the range , has rejected the price as we had talked about. For now I expect a delay between the middle and the top of the range (between $ 48,700 and $ 51,900 ).
The strong recovery signal will be on the breakout from the top of this range . While waiting for an answer we apply the range strategy , that is to say we buy the low to sell the high (unless we want to build a longer term position).
Bitcoin (BTC) analysis in 4 hours
Ether Technical Analysis (ETH)
Now let’s move on to Ether (ETH) .
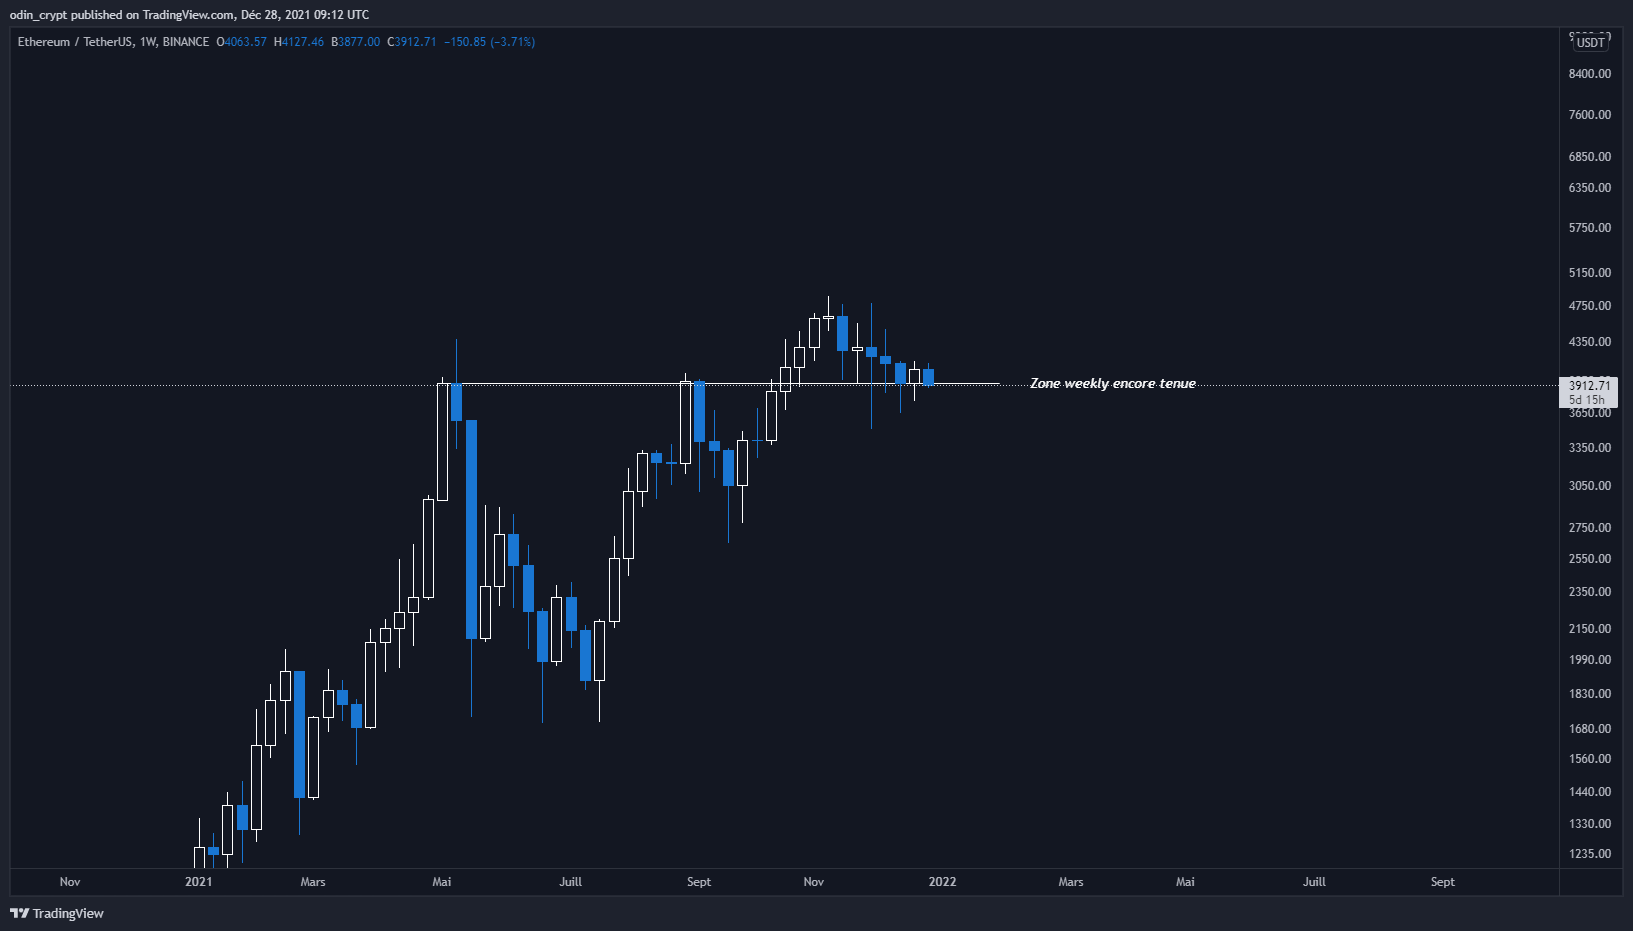
The area repeatedly identified at $ 3,900 remains valid, and Sunday’s weekly close was once again made above it. There is currently no additional information to add on this unit of time. As they say, otherwise it remains bullish.
Ether Analysis (ETH) in 1W
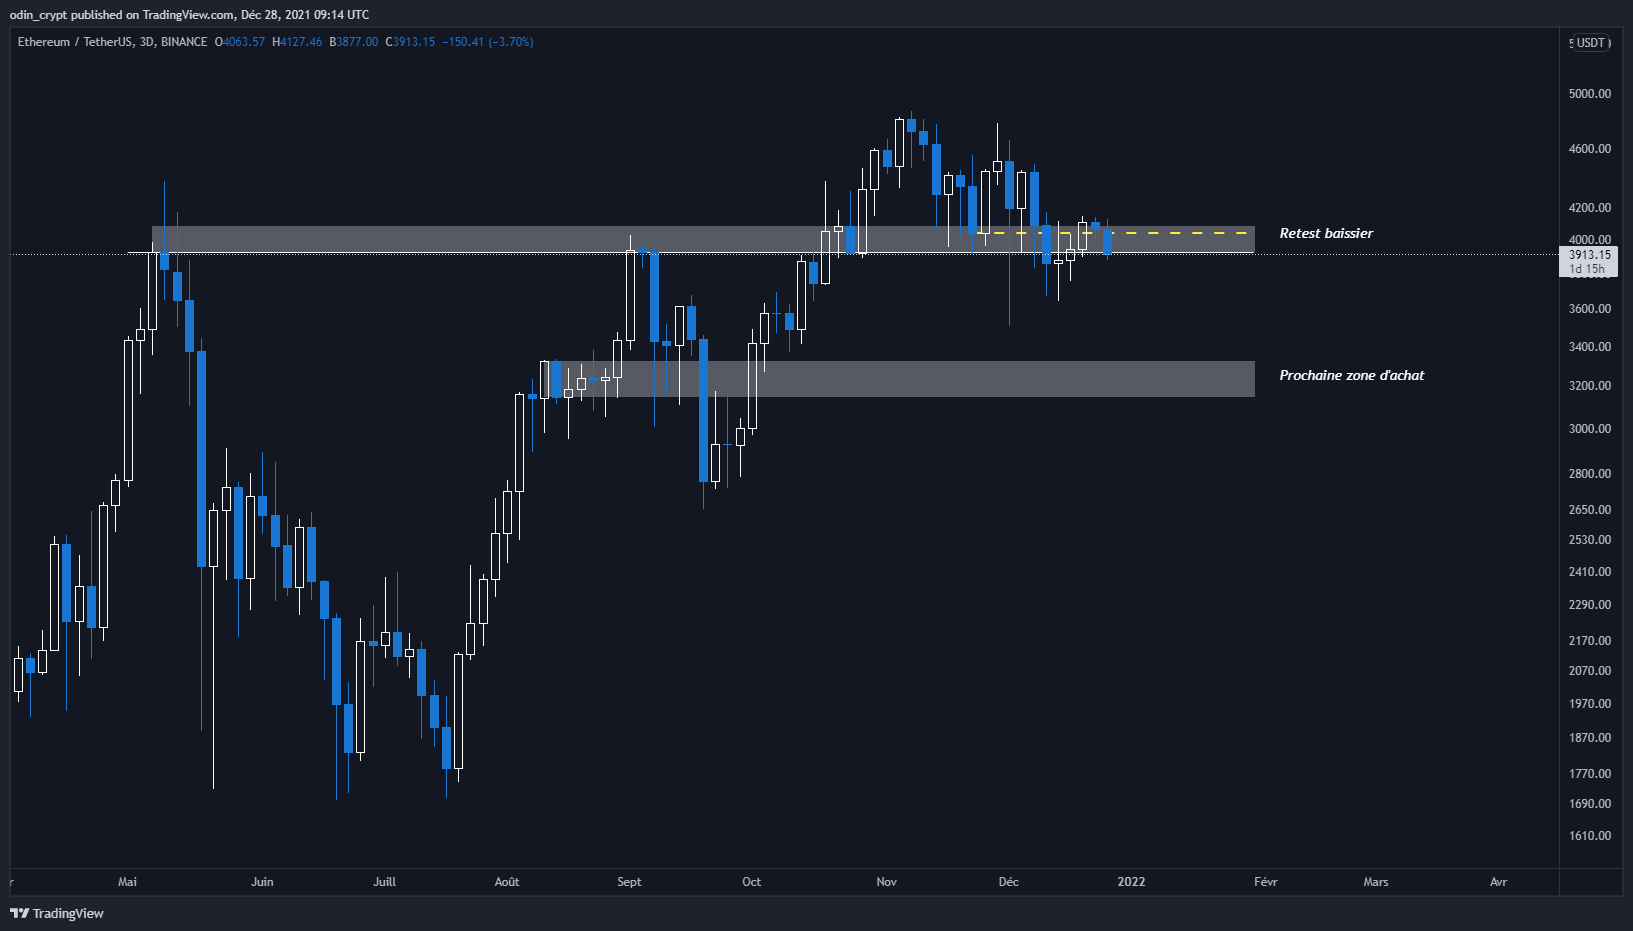
We will have to zoom in on the grouping in 3 days to clarify our analysis. We had identified the $ 3,900 – $ 4,100 area as a pivot. Losing it would take us to the next buy zone which is at $ 3,300 – $ 3,100 .
What I observe as it is, is that the price has just made its bearish retest on the pivot zone. Indeed, we can clearly see a bullish retracement on the last low lost at $ 4,050 . If we follow this logic, the next move should be a loss of the new low at $ 3,850 and thus a loss of the pivot area.
I had mentioned the possibility of a test of the next buying zone , and this is the scenario that gradually seems to emerge. It could be that the price does not manage to cross $ 3,850 which would be a very strong signal to place to buy.
In any case, Ethereum remains in a zone of neutrality and is not yet doing very well in clearing its trend . It will be necessary to remain patient in order not to take a bad position. Let the coming week pass to see how the price will evolve in order to offer (or not) better opportunities.
3D Ether Analysis (ETH)
Avalanche Technical Analysis (AVAX)
To end this column, I wanted to give you the analysis of the Avalanche token (AVAX) which is technically perfect.
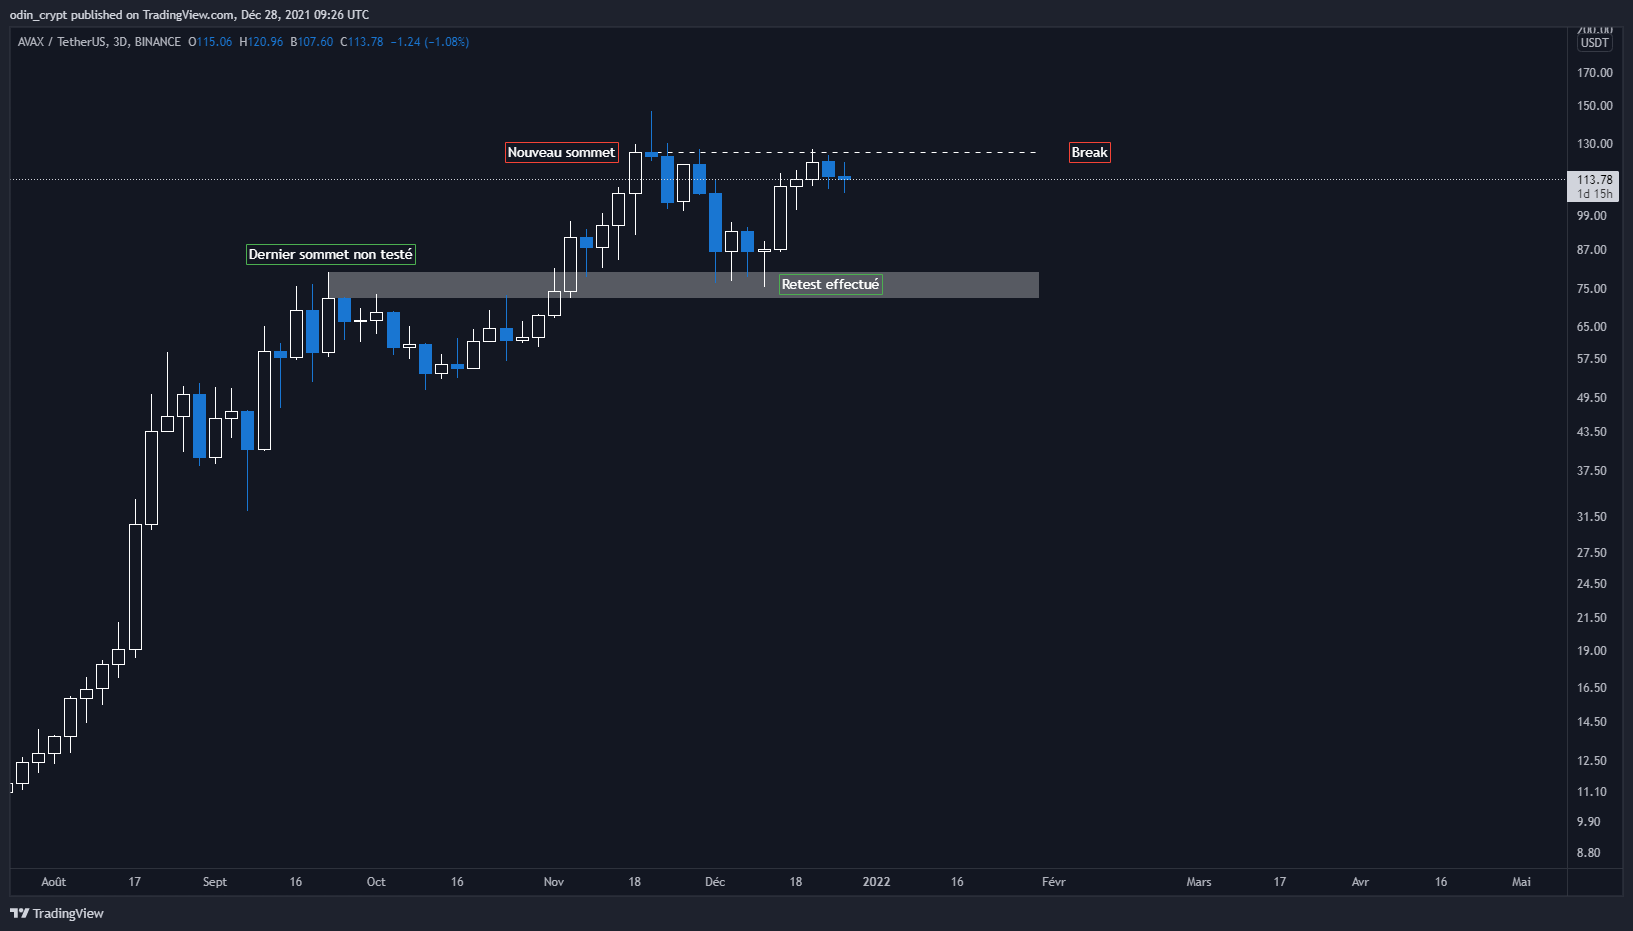
The price has been in a bullish configuration for months now, but still respects very well the principles of break + retest that we mention in each column.
Here, the price had managed to break its last high of $ 80 in November 2021. Since the price had never returned to this zone to confirm this breakout, it had only gone straight towards the $ 150 .
The fall in early December allowed the price to delay in carrying out its retest, which served as a buying zone for many large portfolios. Now what we want to see is a clean break out of the new high at $ 125 in order to continue this uptrend . The theoretical target would be $ 180- $ 190 at first.
In the event of failure here, the price would end up in a situation of ” swing failure pattern ” more commonly called double top or double top. This is a very classic reversal pattern that will change the macro trend from bullish to bearish.
What seems most likely to me right now is a rebound on the current $ 114 zone to seek a new ATH (new all-time high).
3D Avalanche Analysis (AVAX)
In conclusion
There is a nice reaction on the Bitcoin (BTC) side and less on the Ether (ETH) side . Now I expect a retracement on Bitcoin to come out of small wallets to create liquidity. Nonetheless, I remain bullish in the medium term , and I think the $ 53,900 / $ 58,000 will act as resistance in the short term. For Ether (ETH), the situation being different, a deeper retracement may be expected if the $ 3,850 area is lost .
For the Avalanche token (AVAX) , the pattern also remains bullish . A purchase here remains very consistent with a view to price discovery .
I take this opportunity to wish you all a happy end of the year. See you next week for a new analysis.