
Temporarily invalidating the $50,000 resistance, bitcoin (BTC) returns to oscillate within the range established since the start of 2022. Contrasting this lackluster price action, a broad spectrum of investors ranging from retail to institutional appear to be accumulating BTC with exemplary fervor. But that was without counting on the influence of derivatives markets on the short-term price of the queen of crypto-currencies. On-chain analysis of the situation.
Bitcoin retraces once again
The price of Bitcoin (BTC) stumbles below $50,000 and the MA200. Failing to break through these two resistance levels, Bitcoin reenters its range , identified in previous analysis.
Despite BTC hovering around $40,000 again, on-chain data still indicates strong demand is being felt in the market. Interest in Bitcoin does not seem to be waning although the price is correcting.
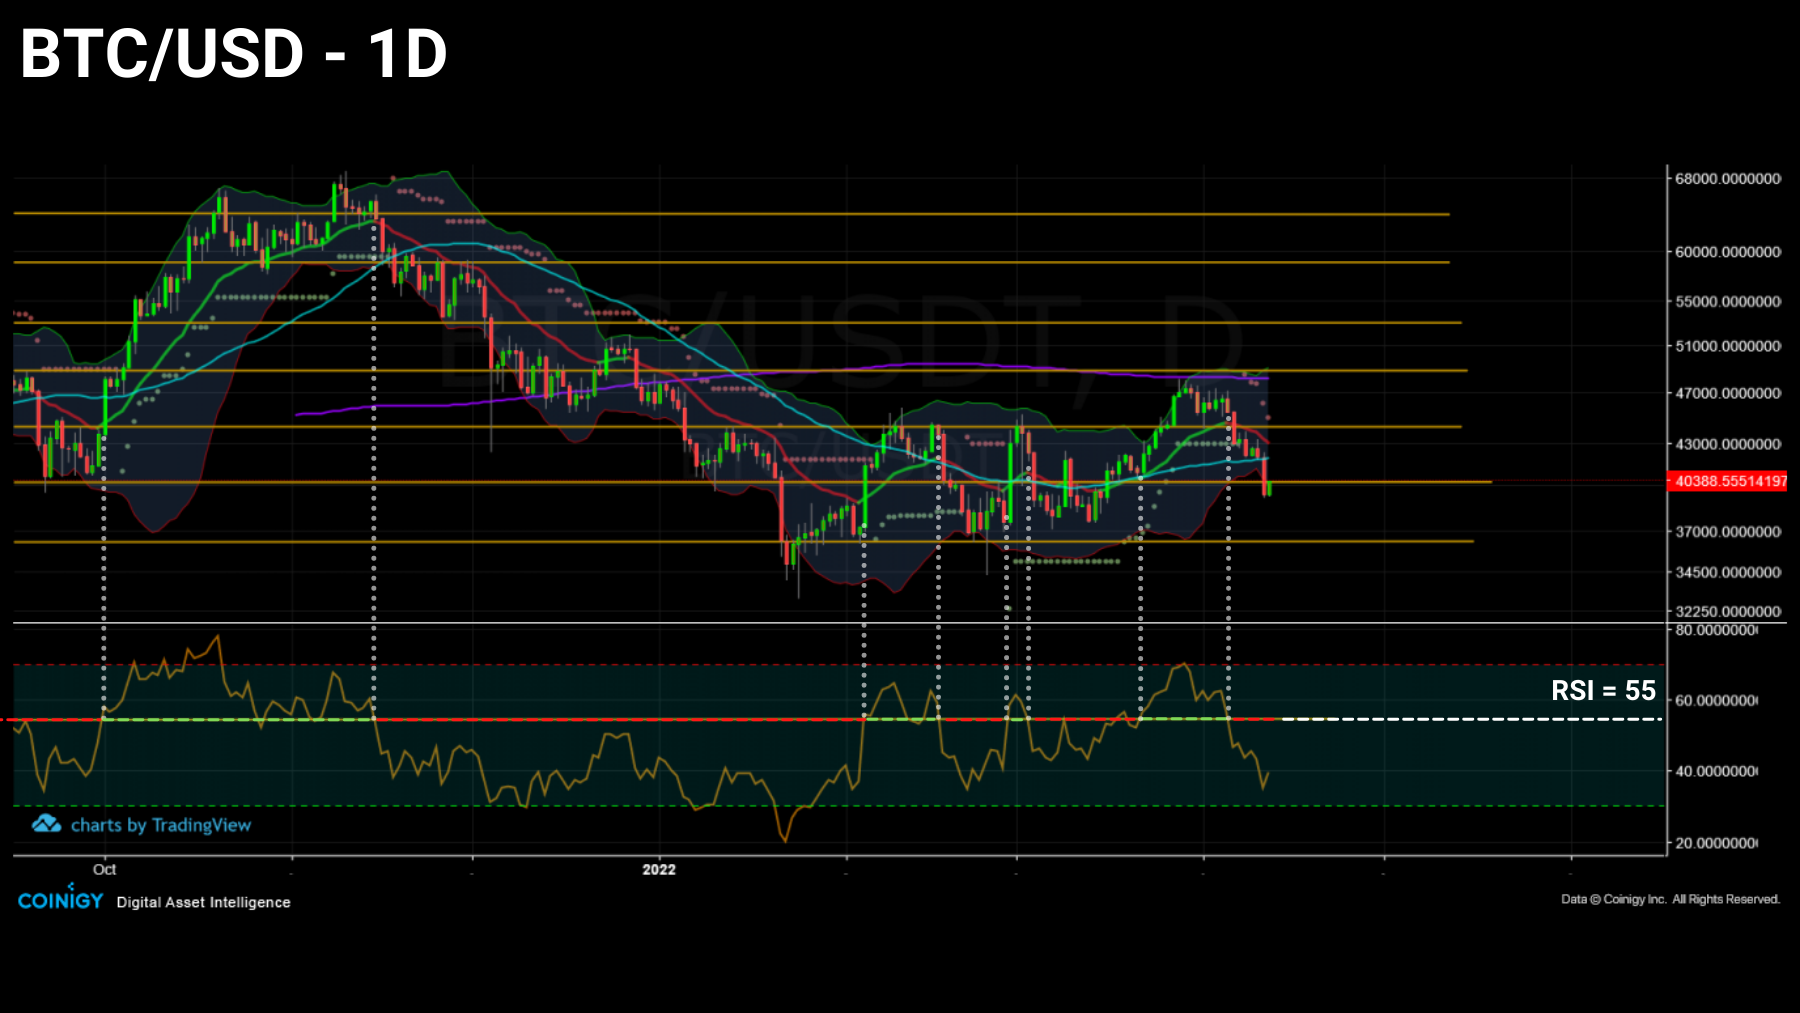
Figure 1: Daily price of Bitcoin (BTC)
This week, we will study the bearish momentum of exchanges’ reserves as well as the demand caused by three major BTC buyers before completing our monitoring of derivatives market risk exposure .
A diligent broad-spectrum accumulation
Let’s start this analysis by introducing a new metric: the Accumulation Trend Score.
This tool was designed by Glassnode, in order to measure the overall accumulation of investors’ portfolios. It lets you know when large entities (whales) and/or large portions of the market (shrimp, in large numbers) are accumulating or liquidating BTC, all while filtering miners and exchanges.
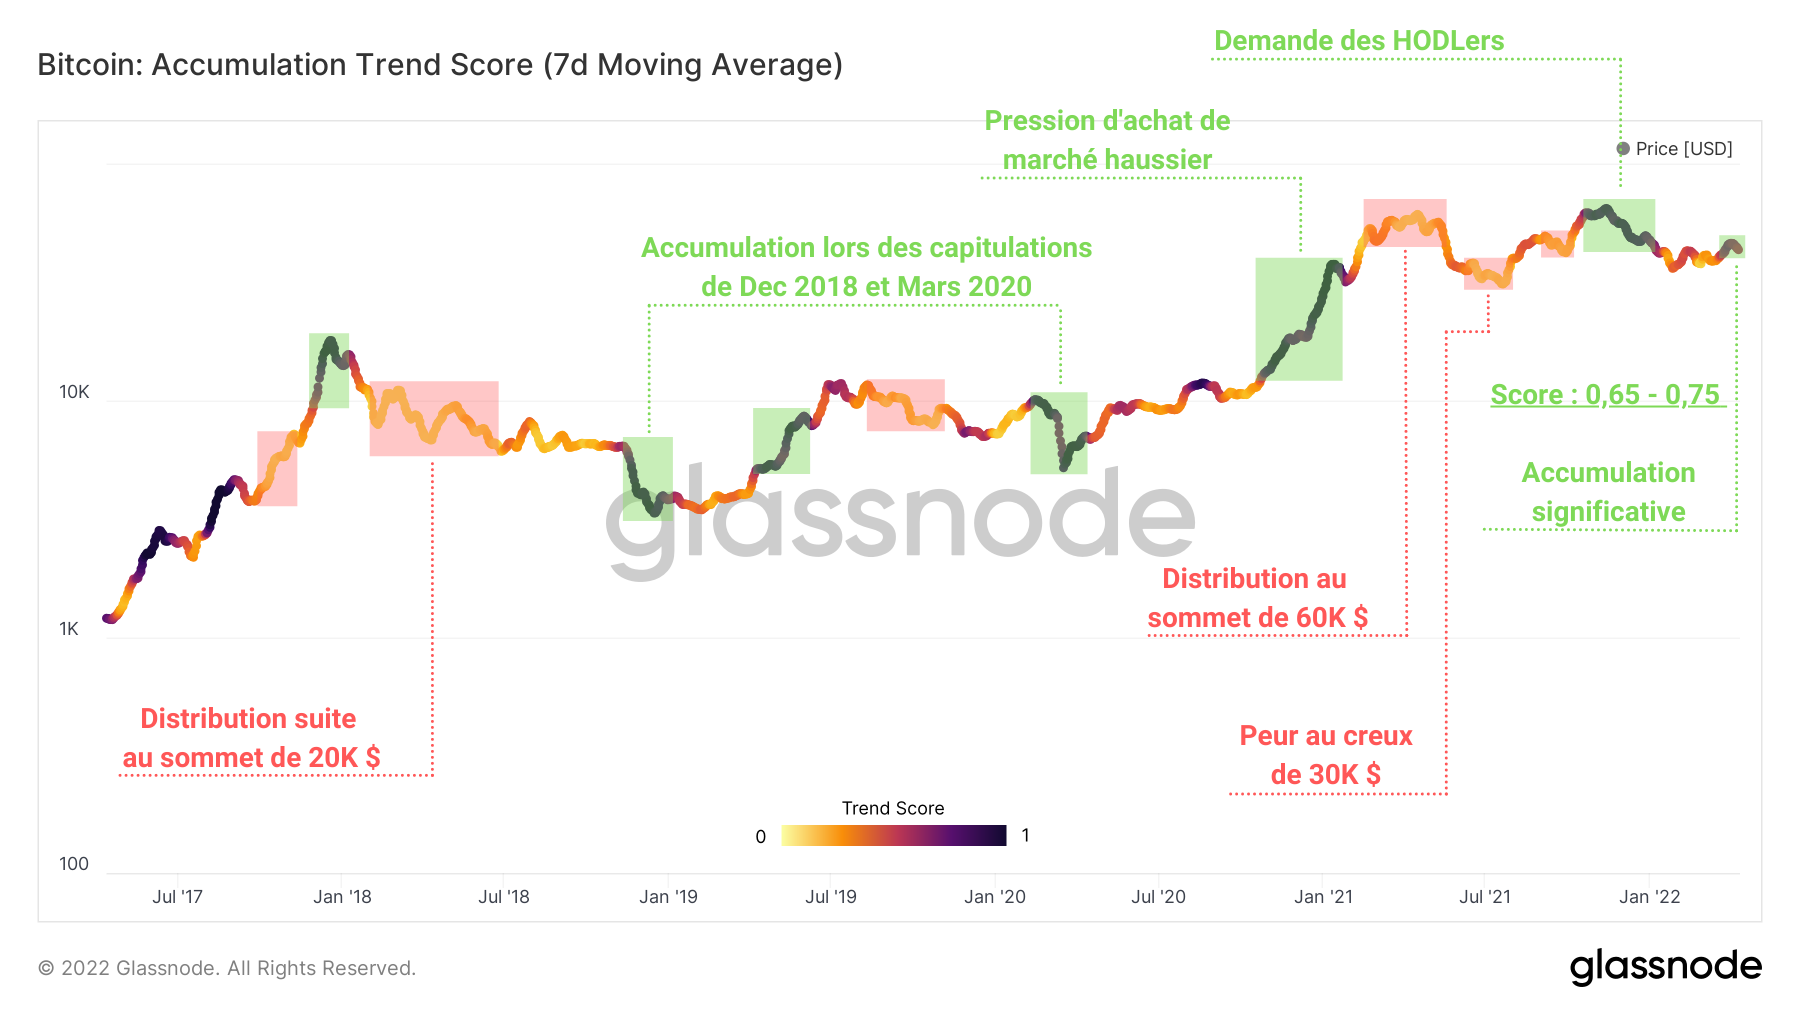
Figure 2: BTC Accumulation Trend Score
The metric oscillates between the values 0 and 1 with the following interpretation:
- Values near 0 (yellow/orange) indicate that the market is distributing or that there is little significant accumulation (bearish).
- Values near 1 (purple) indicate that the market is in net accumulation and the balance of investors’ portfolios is increasing significantly (bullish).
This week, a steady stream of values above 0.65 has been recorded, indicating that a general accumulation trend is underway.
This information can be easily confirmed by the study of the total balance of the exchanges, which begins a new decline testifying to massive withdrawals.
After a stagnation in reserves between 2.5 million and 2.6 million BTC since the last quarter of 2021, the total sum of BTC available from centralized exchange platforms now represents only 13% of the supply in circulation .
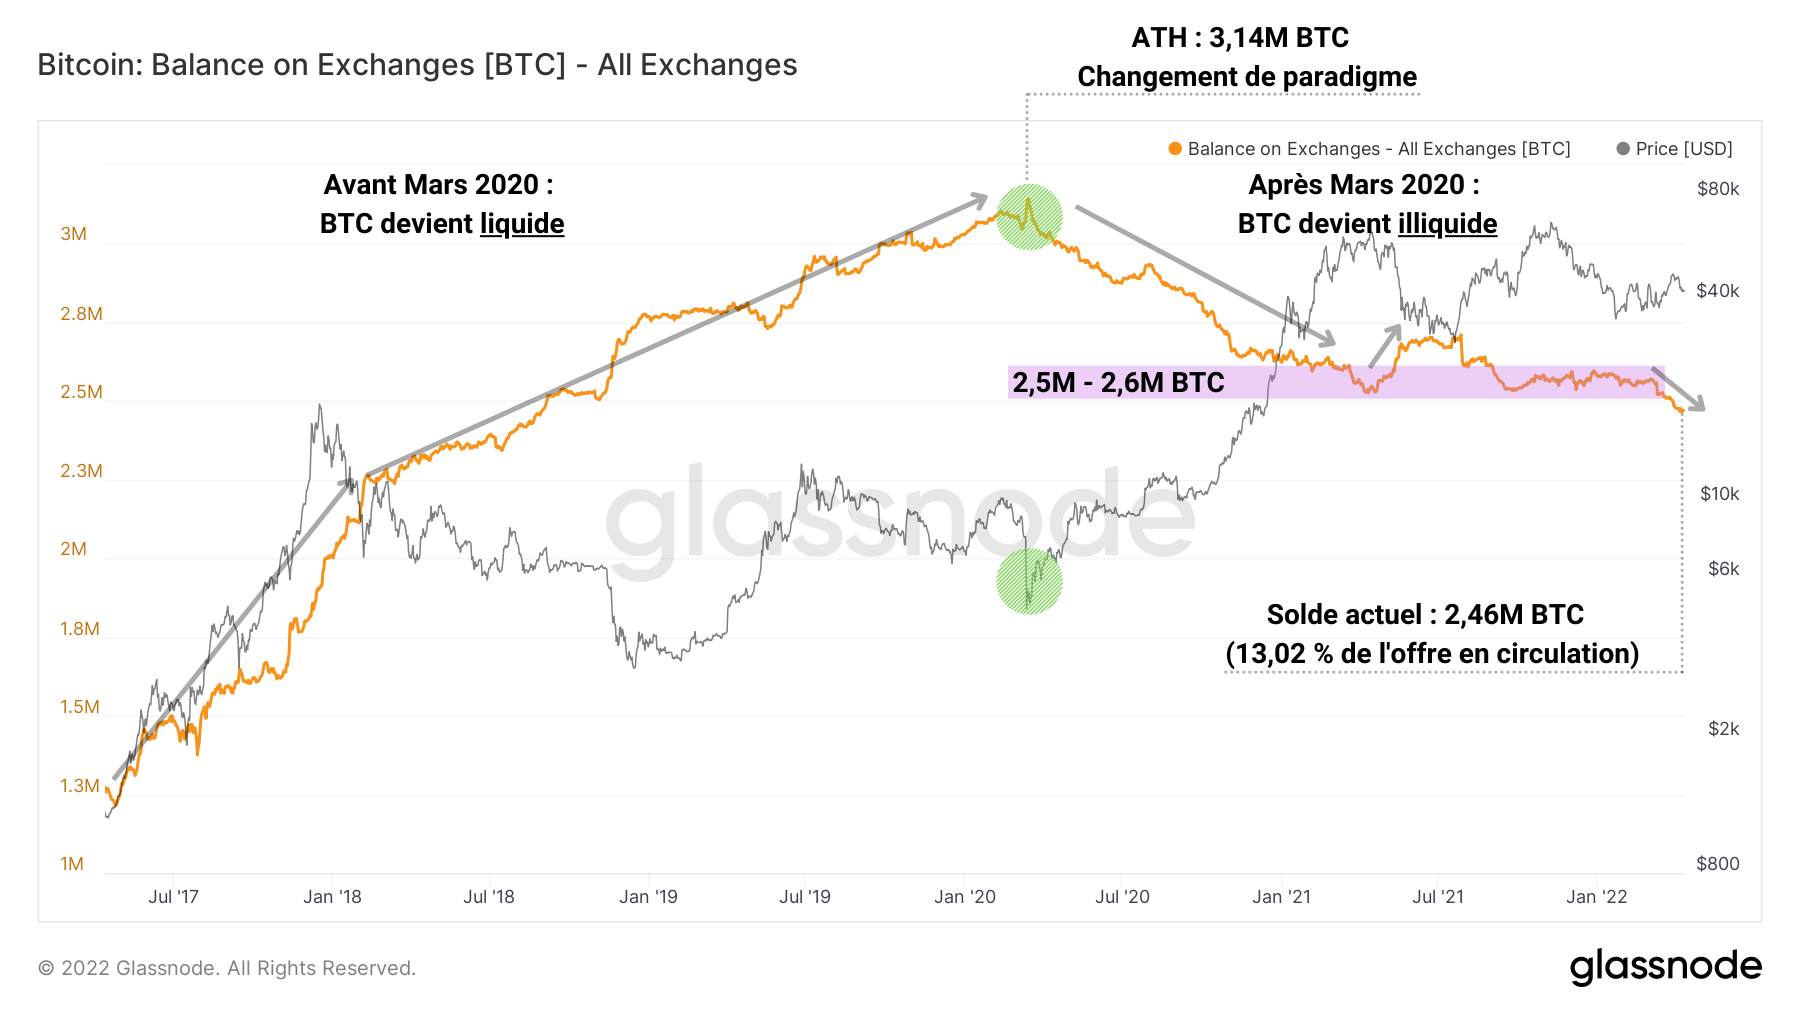
Figure 3: Total Exchange Reserves
It should be noted that, since the March 2020 capitulation, this balance has started a structural downward trend, a sign of a paradigm shift in market participants who today tend to massively accumulate BTC, in particular via DCA strategies. .
This click is clearly visible on the graph below. Representing the monthly change in the total reserves of exchanges, it depicts the periods of deposits (green) and withdrawals (red) over a given period.
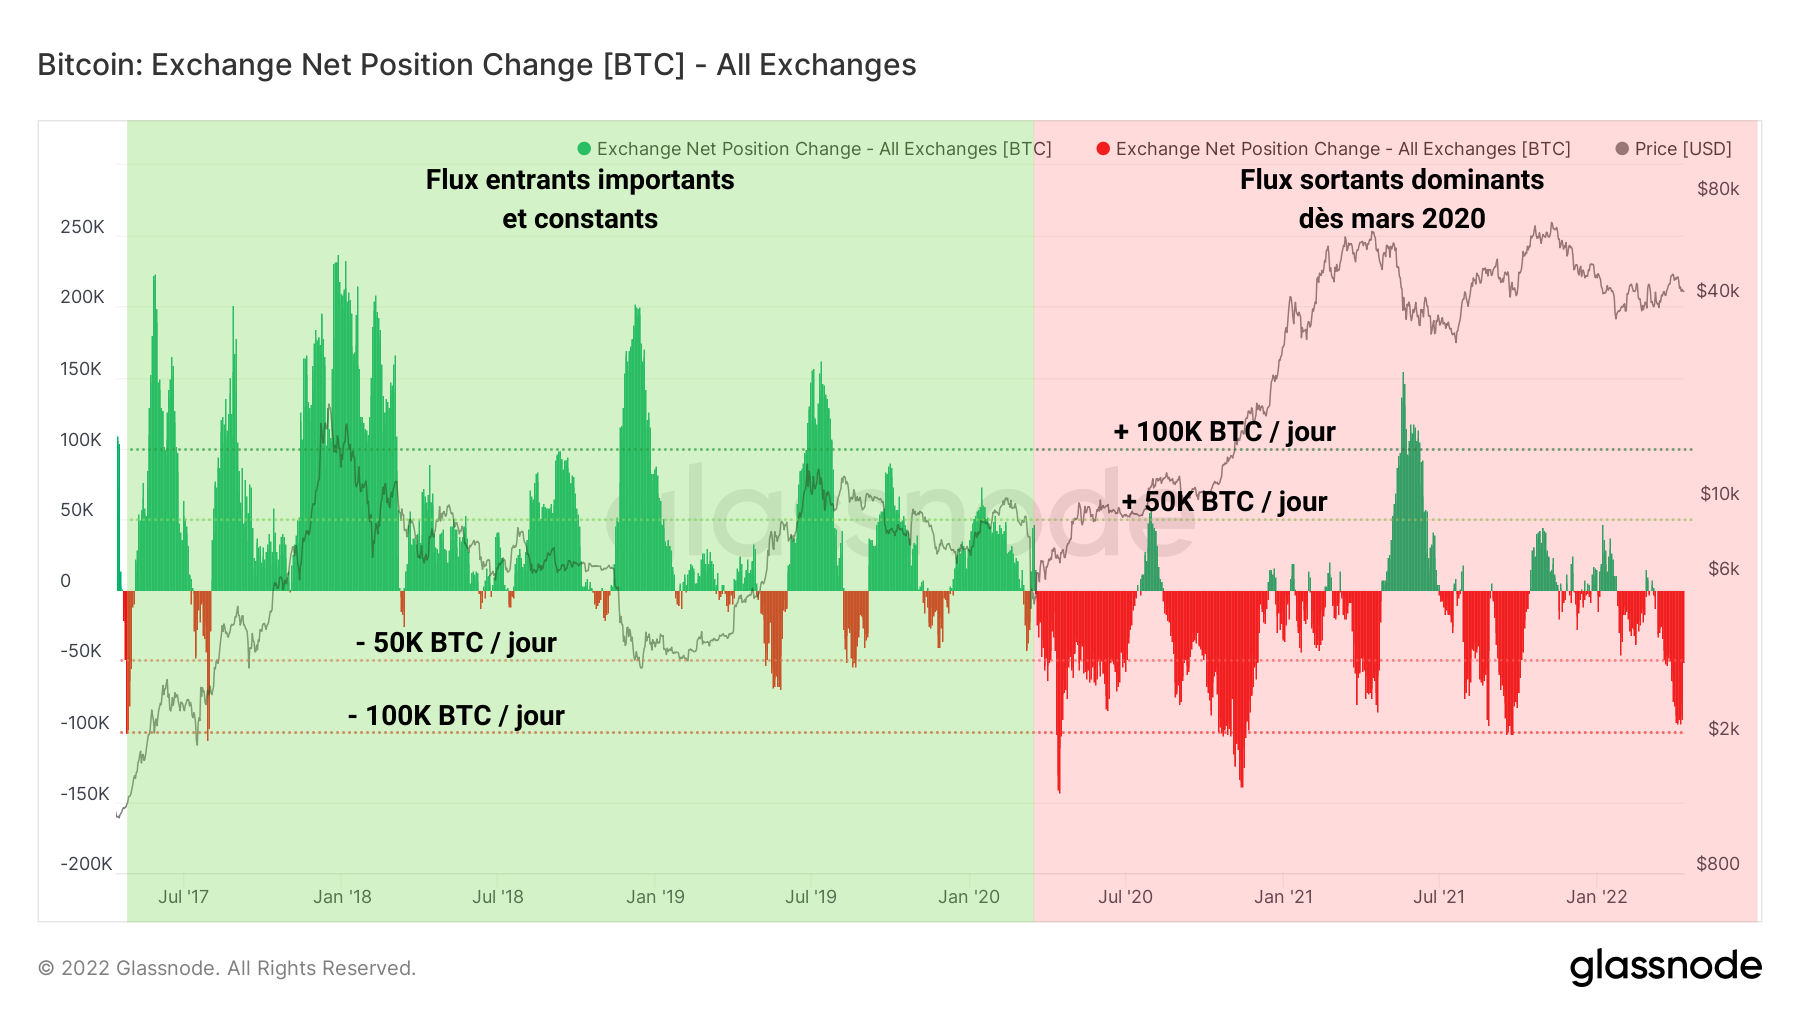
Figure 4: Change in Net Position of exchanges
We can clearly see the amplitudes of the waves of deposits decreasing after March 2020, while withdrawals, which very rarely exceeded 50,000 BTC, have now become a new normal.
The current market structure is therefore part of a dynamic of accumulation and withdrawal of BTC from exchanges to cold-stored portfolios .
Indeed, the number of so-called “illiquid” BTCs (held outside trading platforms and smart contracts) has been growing steadily since July 2021 and currently represents more than 75% of the supply in circulation .
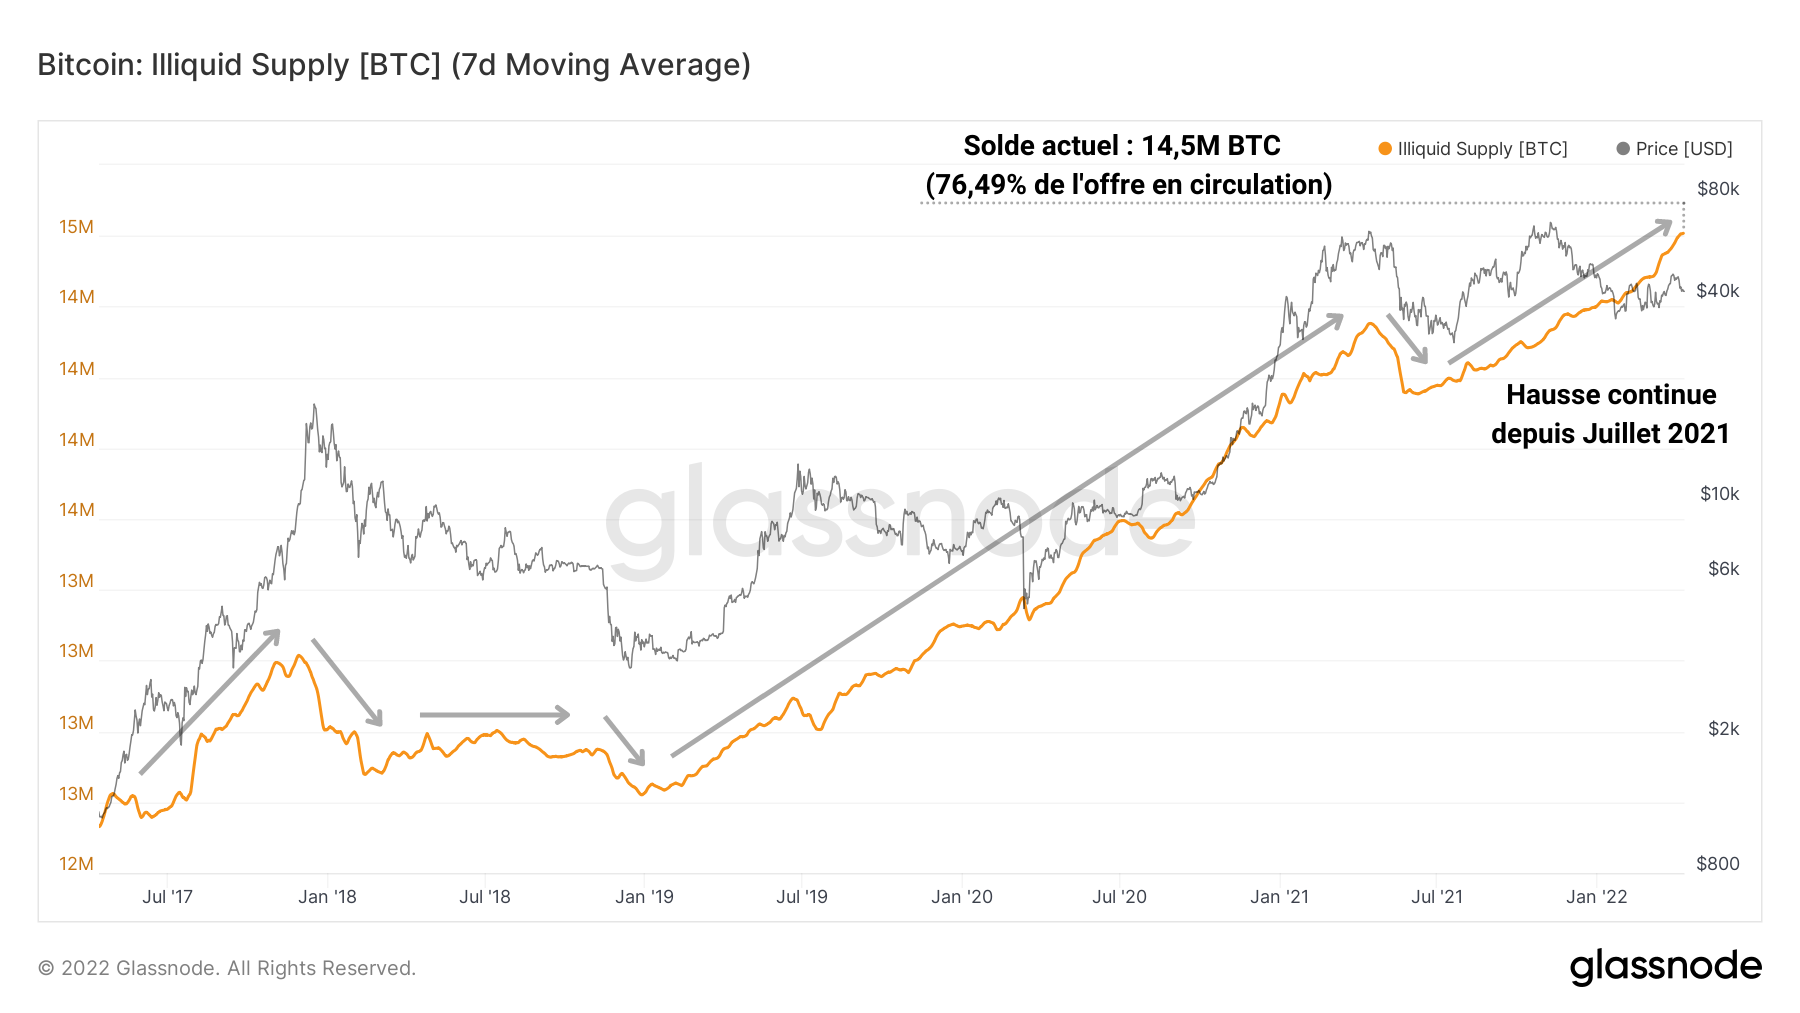
Figure 5: Illiquid Supply
This last graph is impressive for the clarity of its interpretation: BTC leaves the exchanges and is massively accumulated by various entities, drastically decreasing the liquidity of BTC and creating a long-term bullish pressure on the price of bitcoin.
Institutional demand is going well
That said, retail investors are far from the only BTC seekers and it looks like 2022 will see the arrival of new institutional players ready to get their hands on their piece of the pie.
One of the public entities that joined recently is the Luna Foundation Guard (LFG), which amassed a total of 39,897 BTC as of April 11, 2022 following a series of significant purchases.
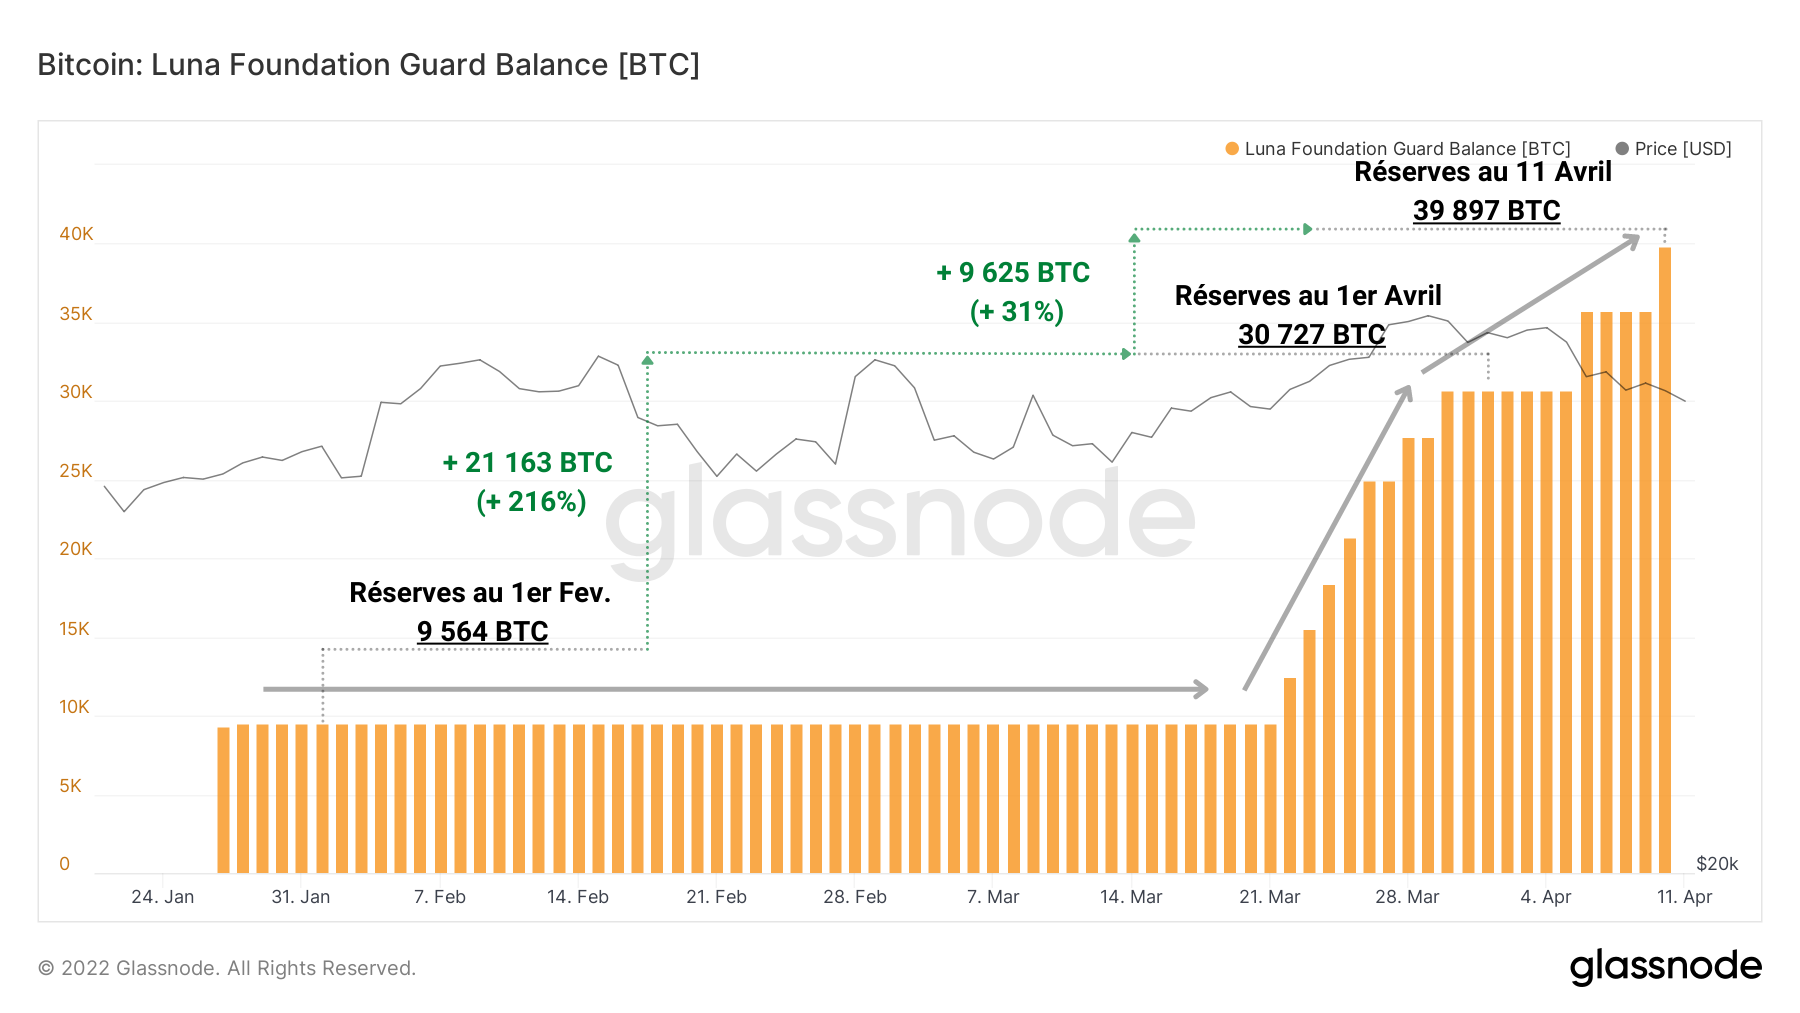
Figure 6: Reserves held by the Luna Foundation Guard
With an initial acquisition of 9,564 BTC at the end of January, valued at $358.6 million, the LFG balance increased by 21,163 BTC in nine days and then again by 9,625 BTC this weekend. The total value of the LFG balance is now over $1.6 billion .
The trend of “wrapping” BTC in a tokenized variant to deploy it on other blockchains has also been constant in recent years.
Over 1.45% of bitcoin supply (275,236 BTC) is now held by custodian BitGo, and issued as the tokenized version WBTC on the Ethereum blockchain.
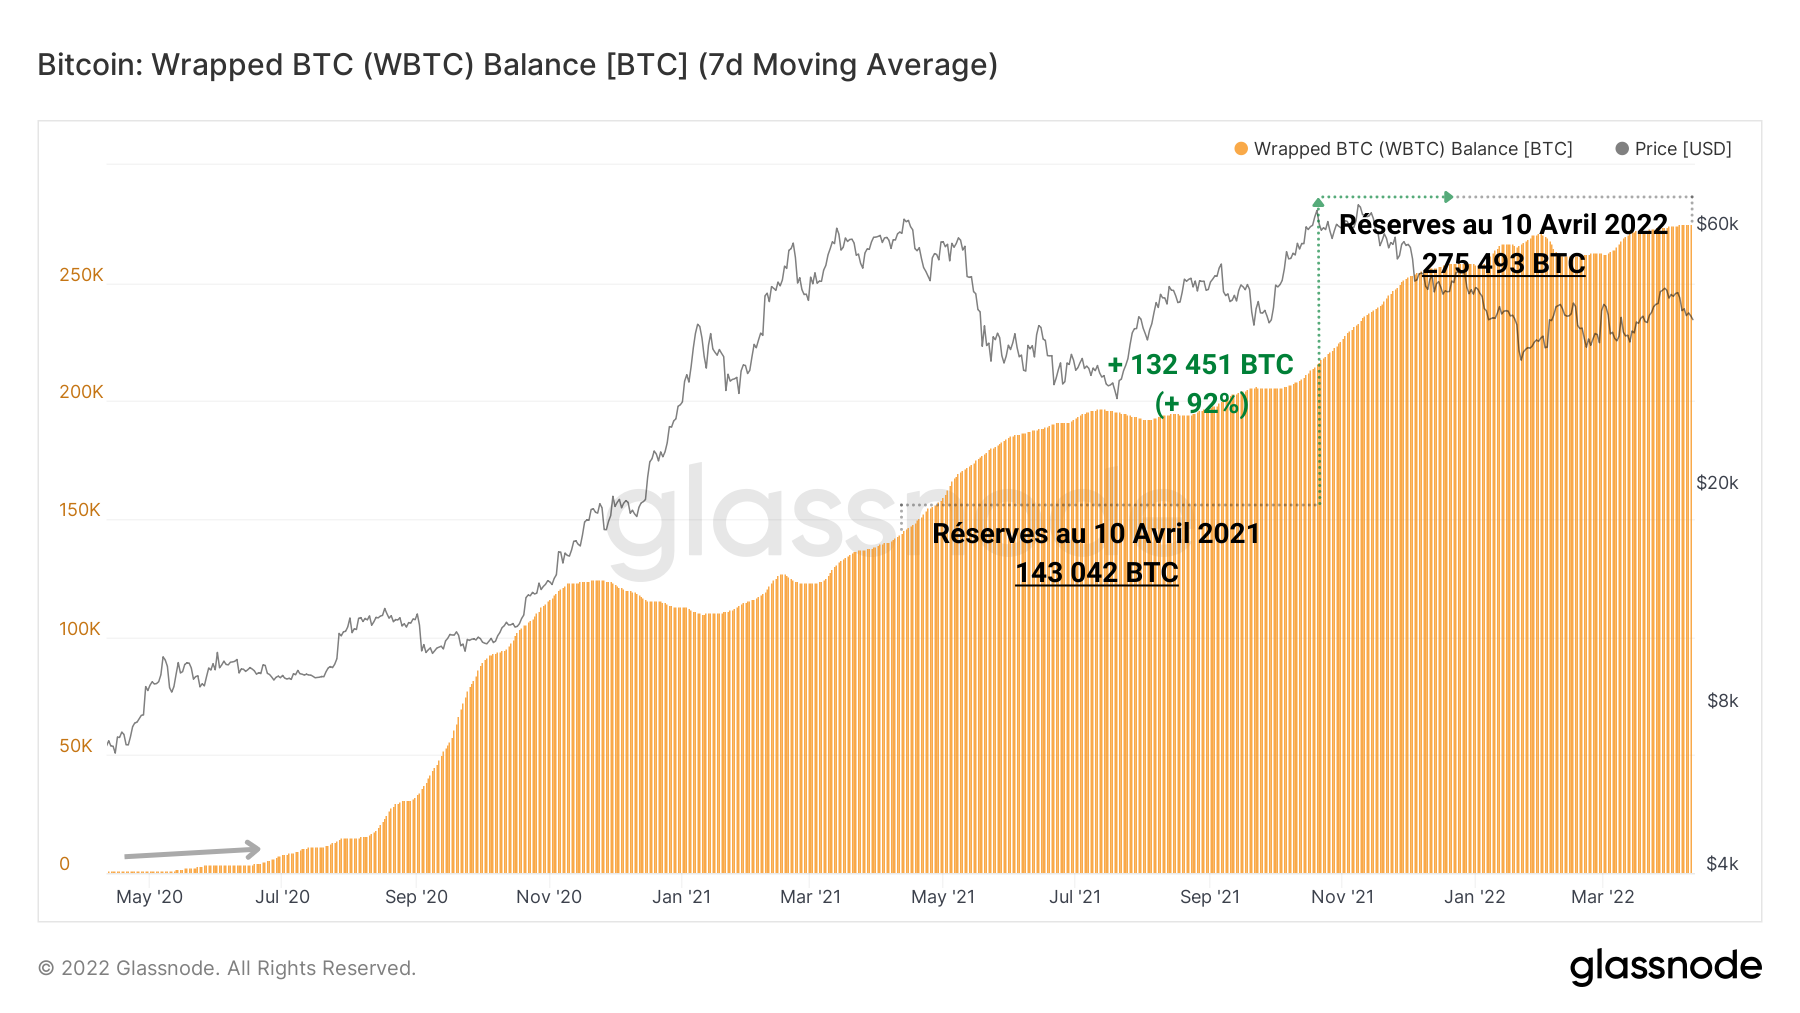
Figure 7: Reserves held as Wrapped BTC
Since the April 2020 peak, the supply of WBTC has increased by an additional 132,451 BTC, indicating increased demand for bitcoin collateral in the decentralized finance (DeFi) sector, despite the uncertain macroeconomic and geopolitical conditions.
We can also blame heavy buying from Canadian ETFs , with the Purpose Bitcoin ETF receiving the largest share. Overall, the total holdings of all these ETFs have increased by 6,594 BTC since the low in late January, to an all-time high of over 69,000 BTC (0.36% of circulating supply).
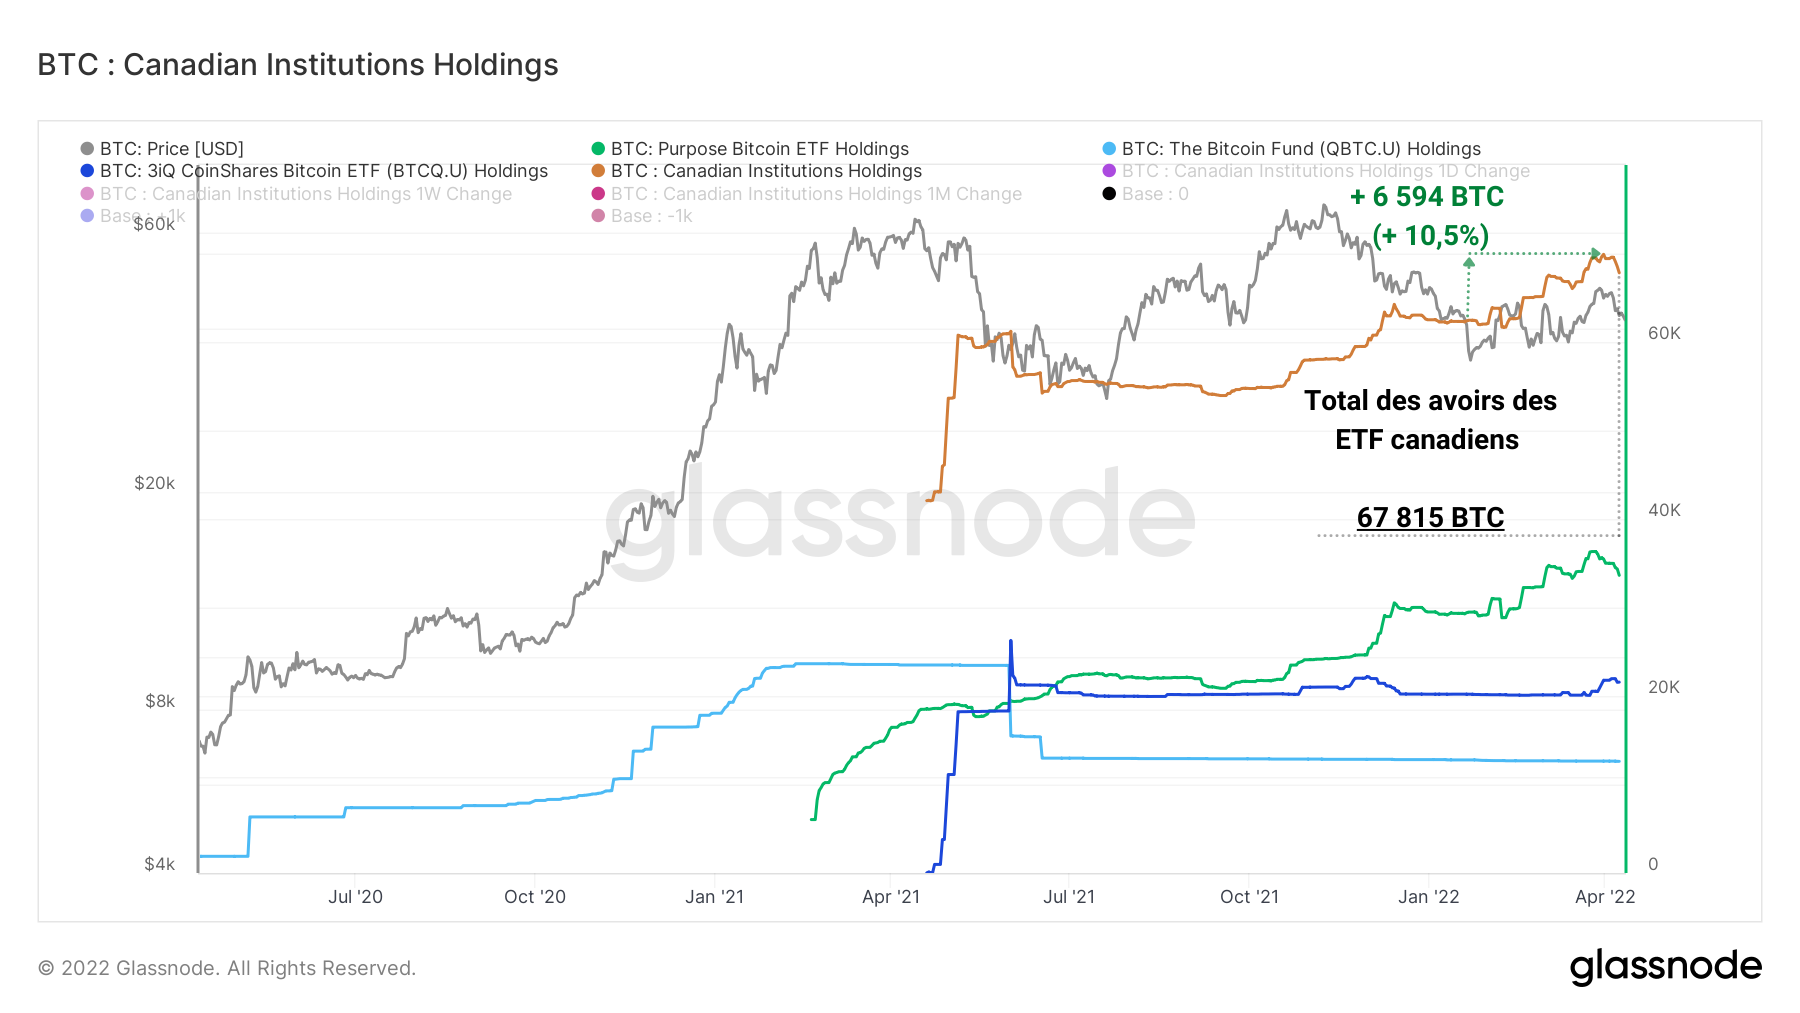
Figure 8: Reserves held by Canadian ETFs
Such strong withdrawals from exchanges, as well as strong inflows into ETFs, DeFi apps and consumer accumulation wallets signal that strong demand remains despite global economic uncertainty.
ATH of speculative risk in derivatives markets
However, it seems that the interest in Bitcoin has not spared the derivatives markets. While we alerted you to the notable return of risk-taking two weeks ago, it seems that speculators present on the derivatives markets still have their say.
Indeed, we can currently observe extreme risk-taking , increasing the likelihood of seeing a squeeze (whether long or short) trigger.
The dominance of future open interest in BTC, calculated as the ratio of Bitcoin market capitalization to total funds allocated to future contracts, is currently at an all-time high, indicating that the influence of derivatives markets on the price of BTC is greatly increased .
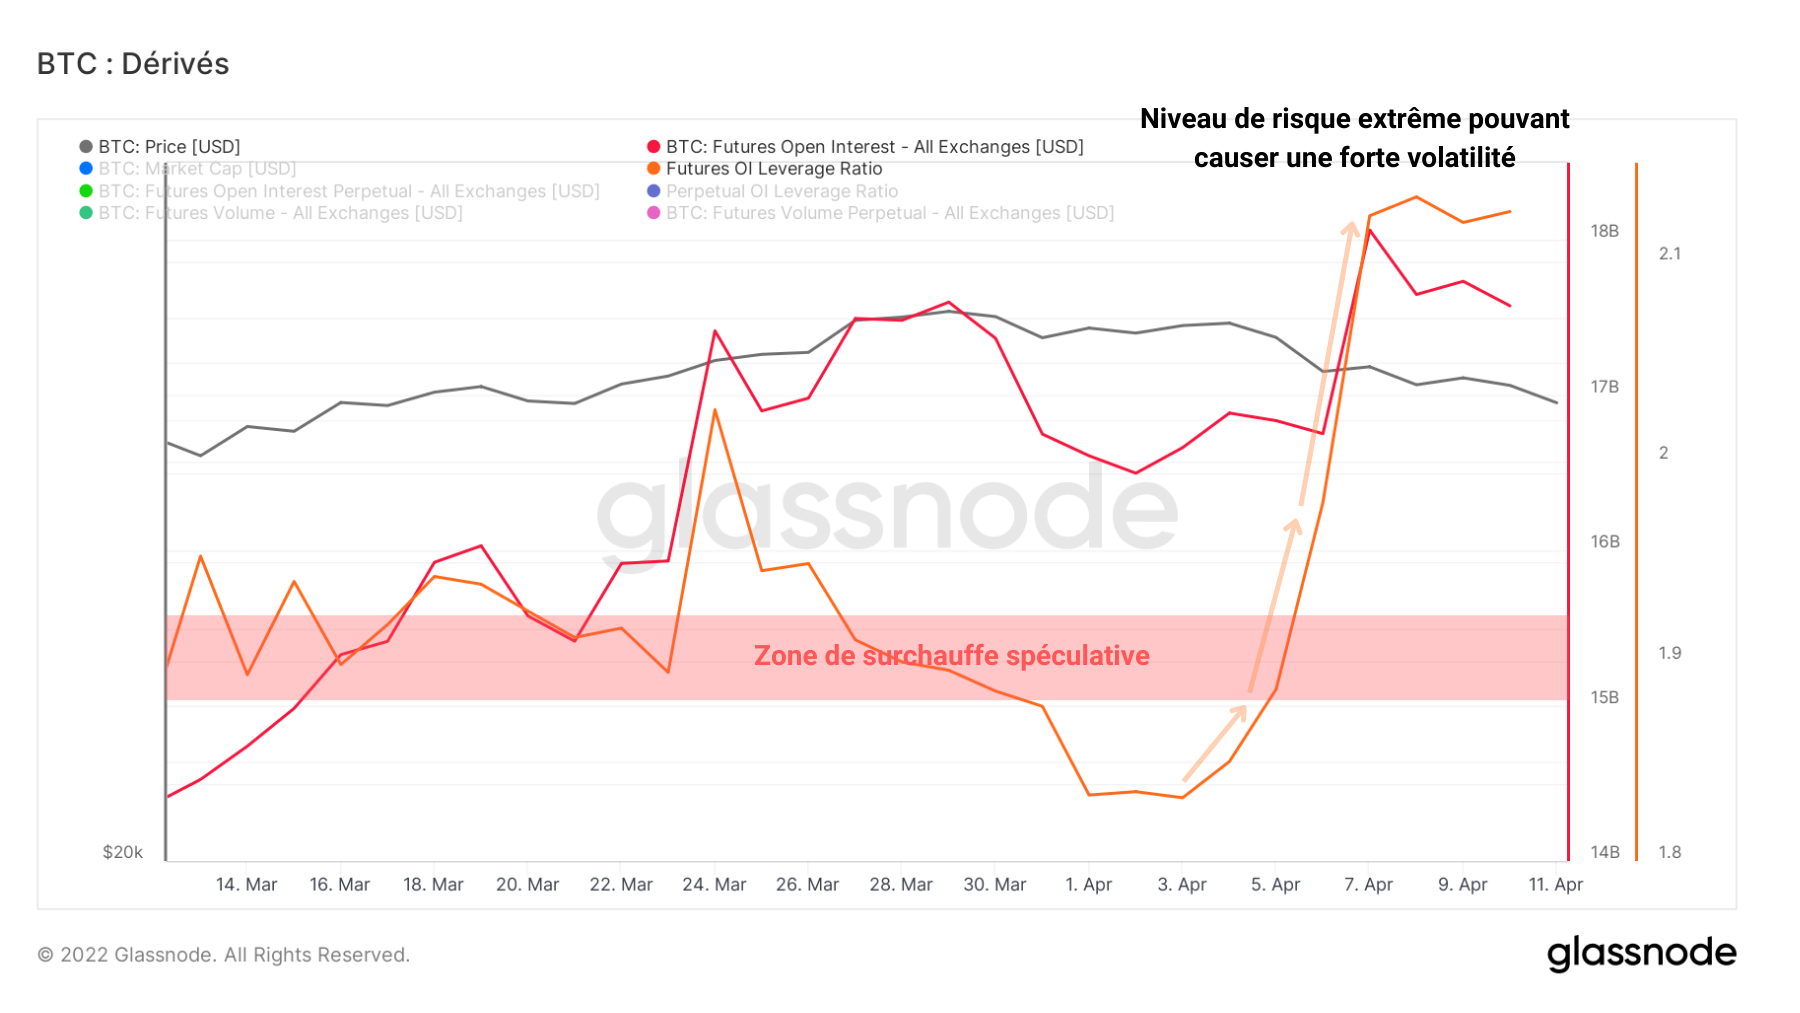
Figure 9: Open Interest Leverage Ratio
Similarly, the estimated ratio of leverage deployed in perpetual contracts greatly exceeds its overheating threshold of 1.3 and currently exceeds 1.5. This means that the total funds allocated to this type of contract represent more than 5% of the market capitalization of BTC.
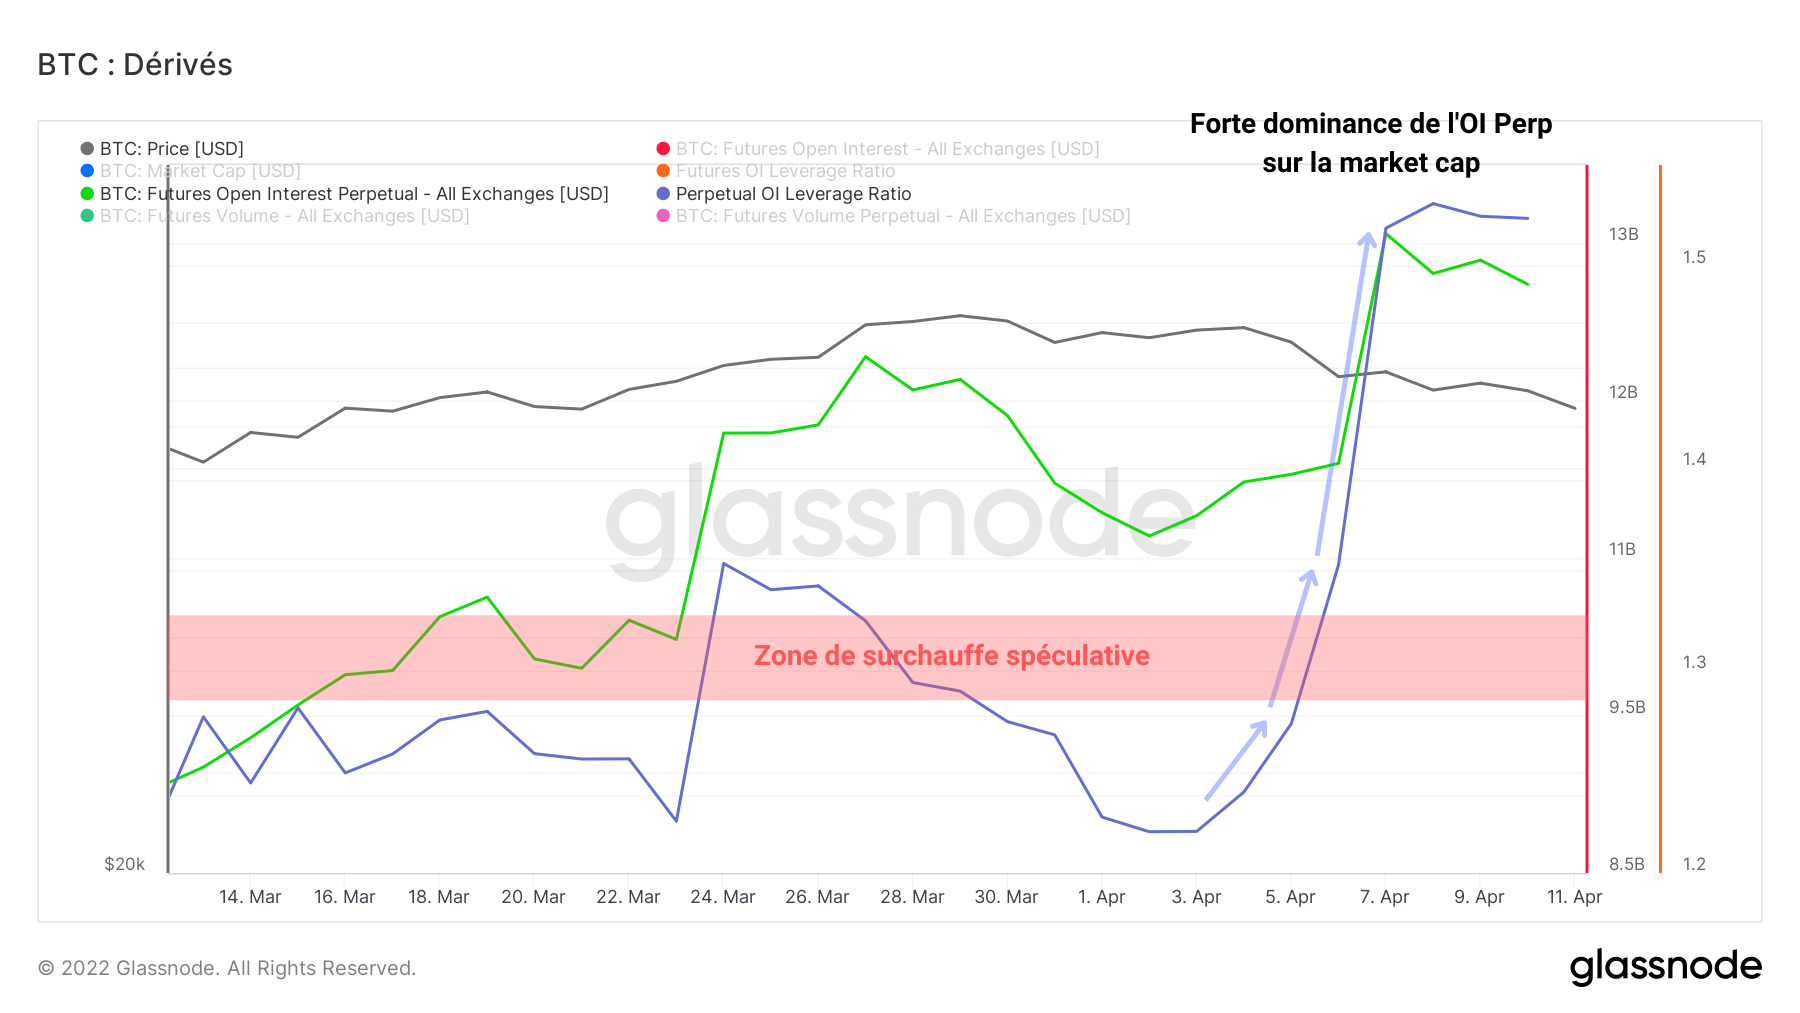
Figure 10: Perpetual Open Interest Leverage Ratio
This observation of the excessive risk taking present on the derivatives markets is explained in particular by an inflow of more than 2.7 billion dollars which occurred on Thursday, April 7, when the BTC began its decline.
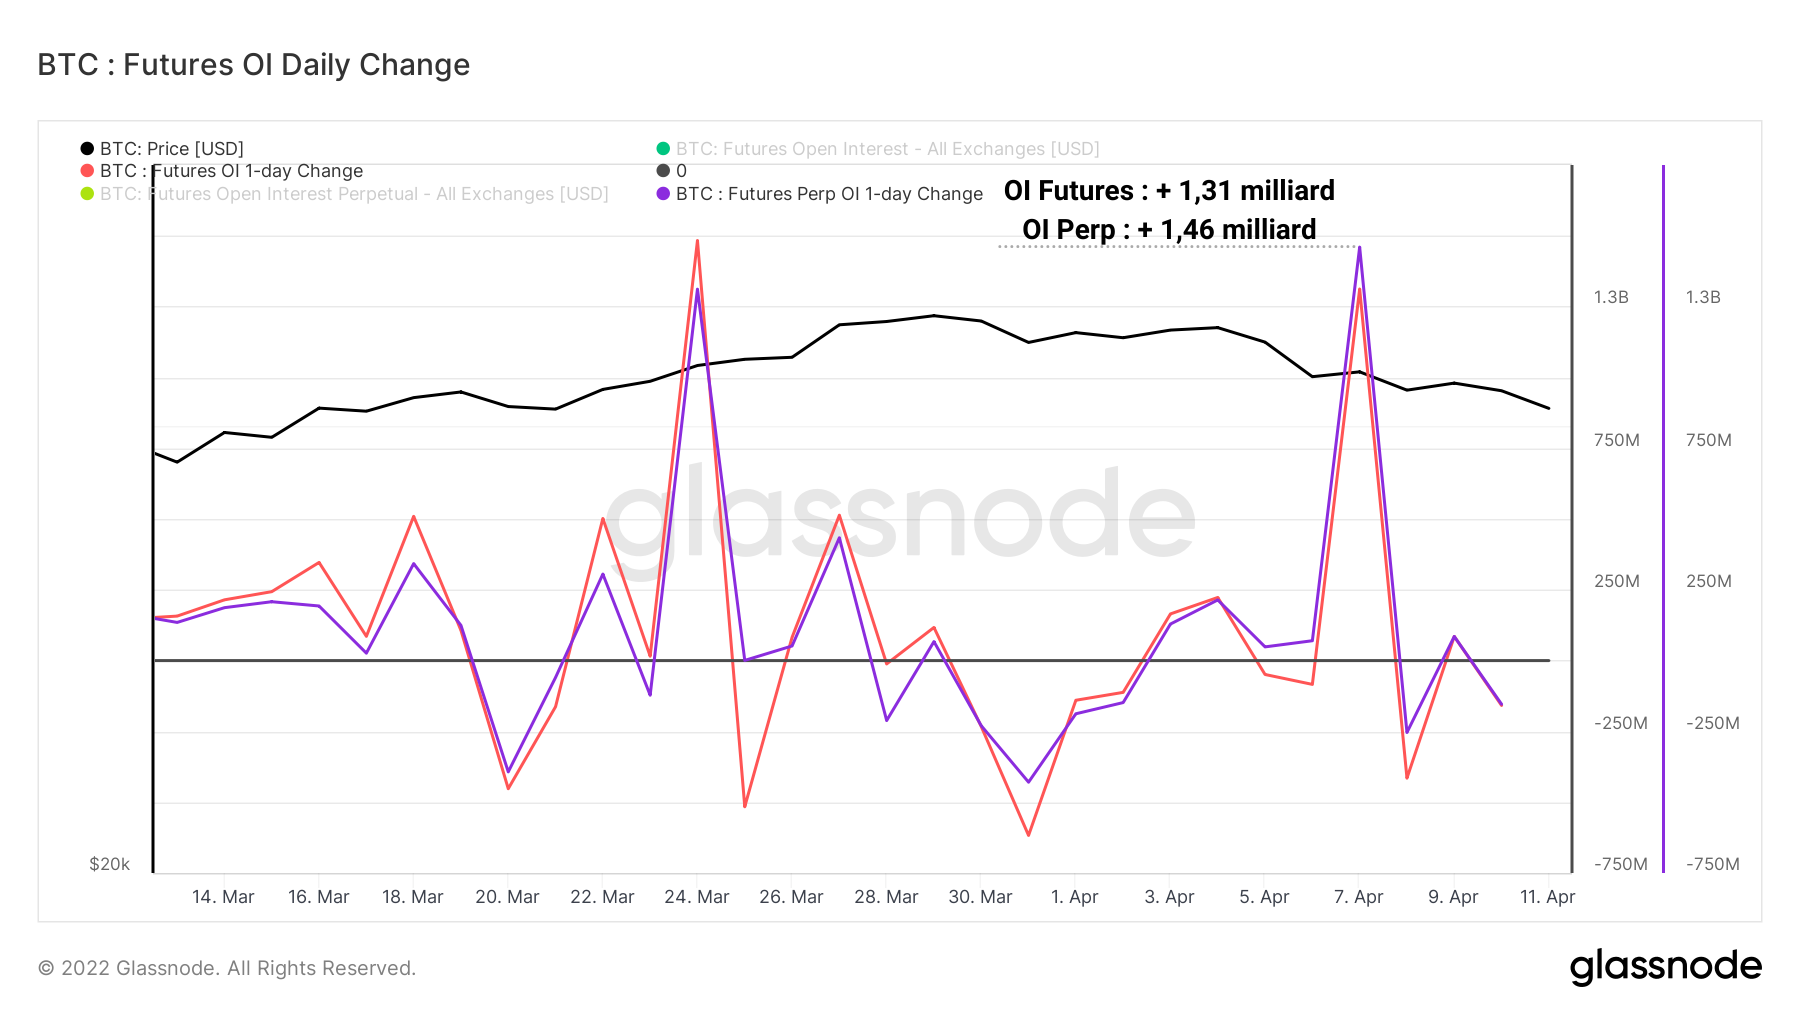
Figure 11: Weekly change in open interest
It is this discrepancy between the funds allocated purely to bitcoin and those allocated to speculation tools that caused a drastic increase in the value of the leverage ratio depicted above.
As BTC corrects, speculators are getting aggressive and seem willing to take risks that could leave the broader market uncertain as to where the next volatile price move is headed.
Summary of this on-chain analysis
Finally, the current price correction does not seem to worry investors who are always accumulating more bitcoins with the aim of keeping them in their custody for the long term.
As exchange reserves begin a new structural decline , the illiquid BTC ratio has now reached 3 to 4. In other words: more than 75% of bitcoins in circulation have reduced probabilities of being spent in the short term, a sign of strong conviction and price insensitivity from a broad spectrum of market participants.
Institutional investors, led this week by the Luna Foundation Guard, continue to induce buying pressure on Bitcoin by literally sucking in the supply still available for sale. Reflecting strong demand, these entities are demonstrating a diligence in their purchases of BTC which contrasts with the climate of global economic uncertainty.
Finally, it seems that derivatives speculators are also experiencing renewed interest , as the flow of funds into futures and perpetuals has been strong this week. As a result of this enthusiasm, the excessive use of leverage augurs high volatility on the horizon. The scenario of a series of cascading liquidations thus becomes more and more plausible, whatever direction this volatile movement could take.
Sources – Figure 1: Coinigy ; Figures 2 to 13: Glassnode