Bitcoin (BTC) price forms a new leap? Despite a timid distribution of holders over the long term, the losses realized are falling as the market will soon decide its direction. On-chain analysis of the situation.
Bitcoin bounces sixth time on its support
Forming a slight rebound on the bottom of the range between $ 52,000 and $ 46,500, the price of bitcoin (BTC) re-enters the 200 sMA daily and borders on the 21 eMA daily.
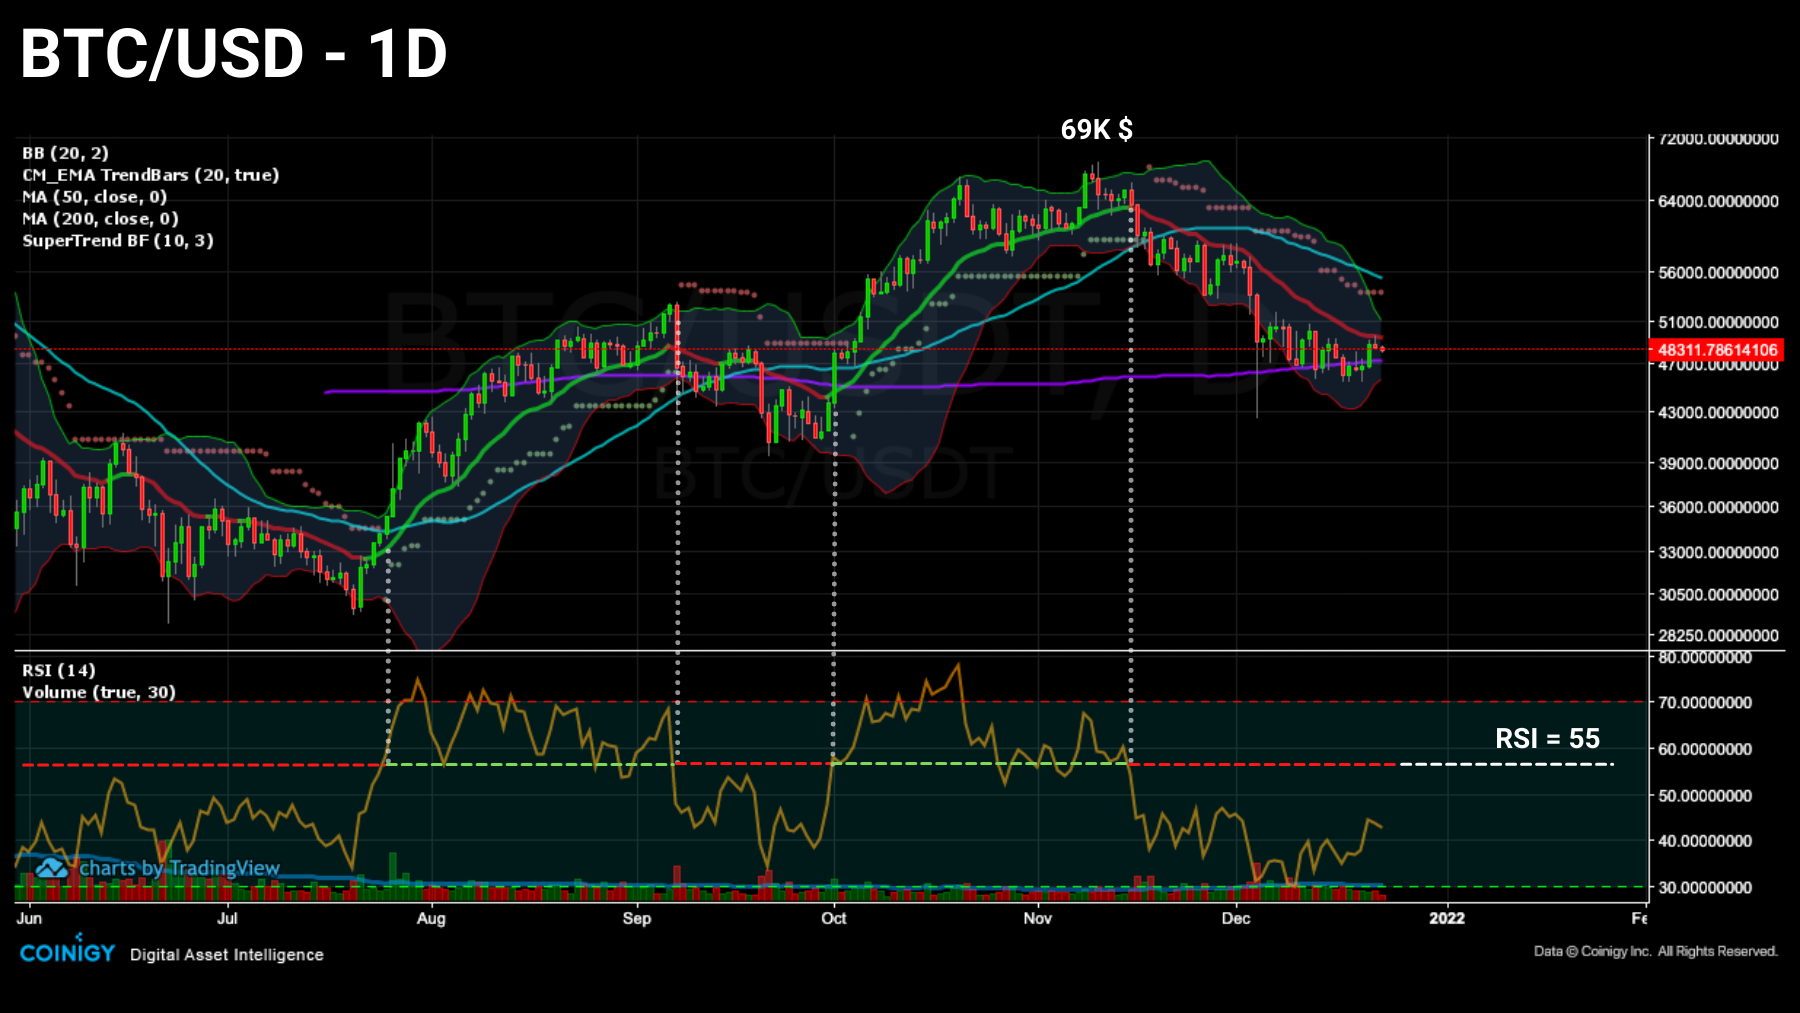
Daily Bitcoin Price Chart (BTC) – Source: Coinigy
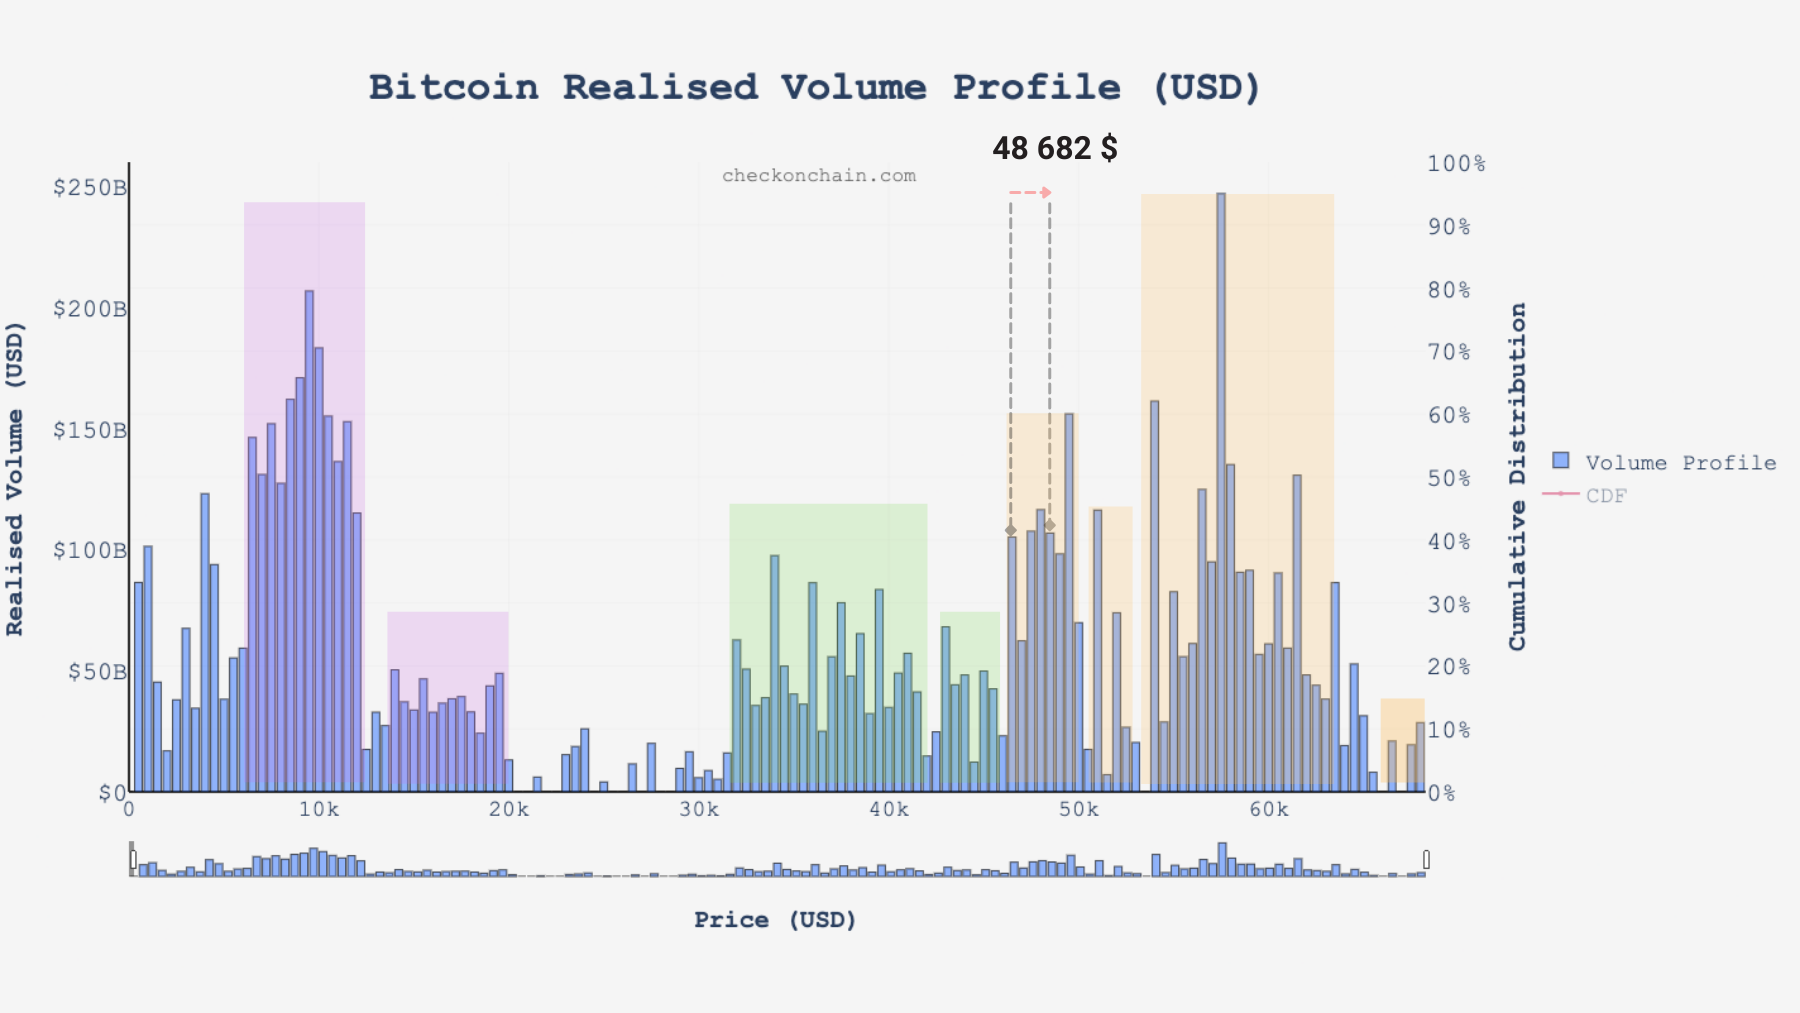
Bitcoin (BTC) is advancing in a moderately dense cluster of volume where the $ 50,000 zone serves as a threshold to be crossed in the short term.
Bitcoin Realized Volume Graph (BTC) – Source: checkonchain.com
Let’s continue our monitoring of spending dynamics in order to see the behavior of participants at this stage of the correction. The profitability and age of BTC tokens will indicate the relative involvement of cohorts and momentum will tell us about the inertia of the current movement.
Decrease and convergence of spending
To begin with, note that for almost 2 weeks, the losses and profits made on the channel have been decreasing together .
This common decline indicates on the one hand that profitable investors do not want to realize their gains at such price levels and on the other hand that losing investors are slowing down their spending.
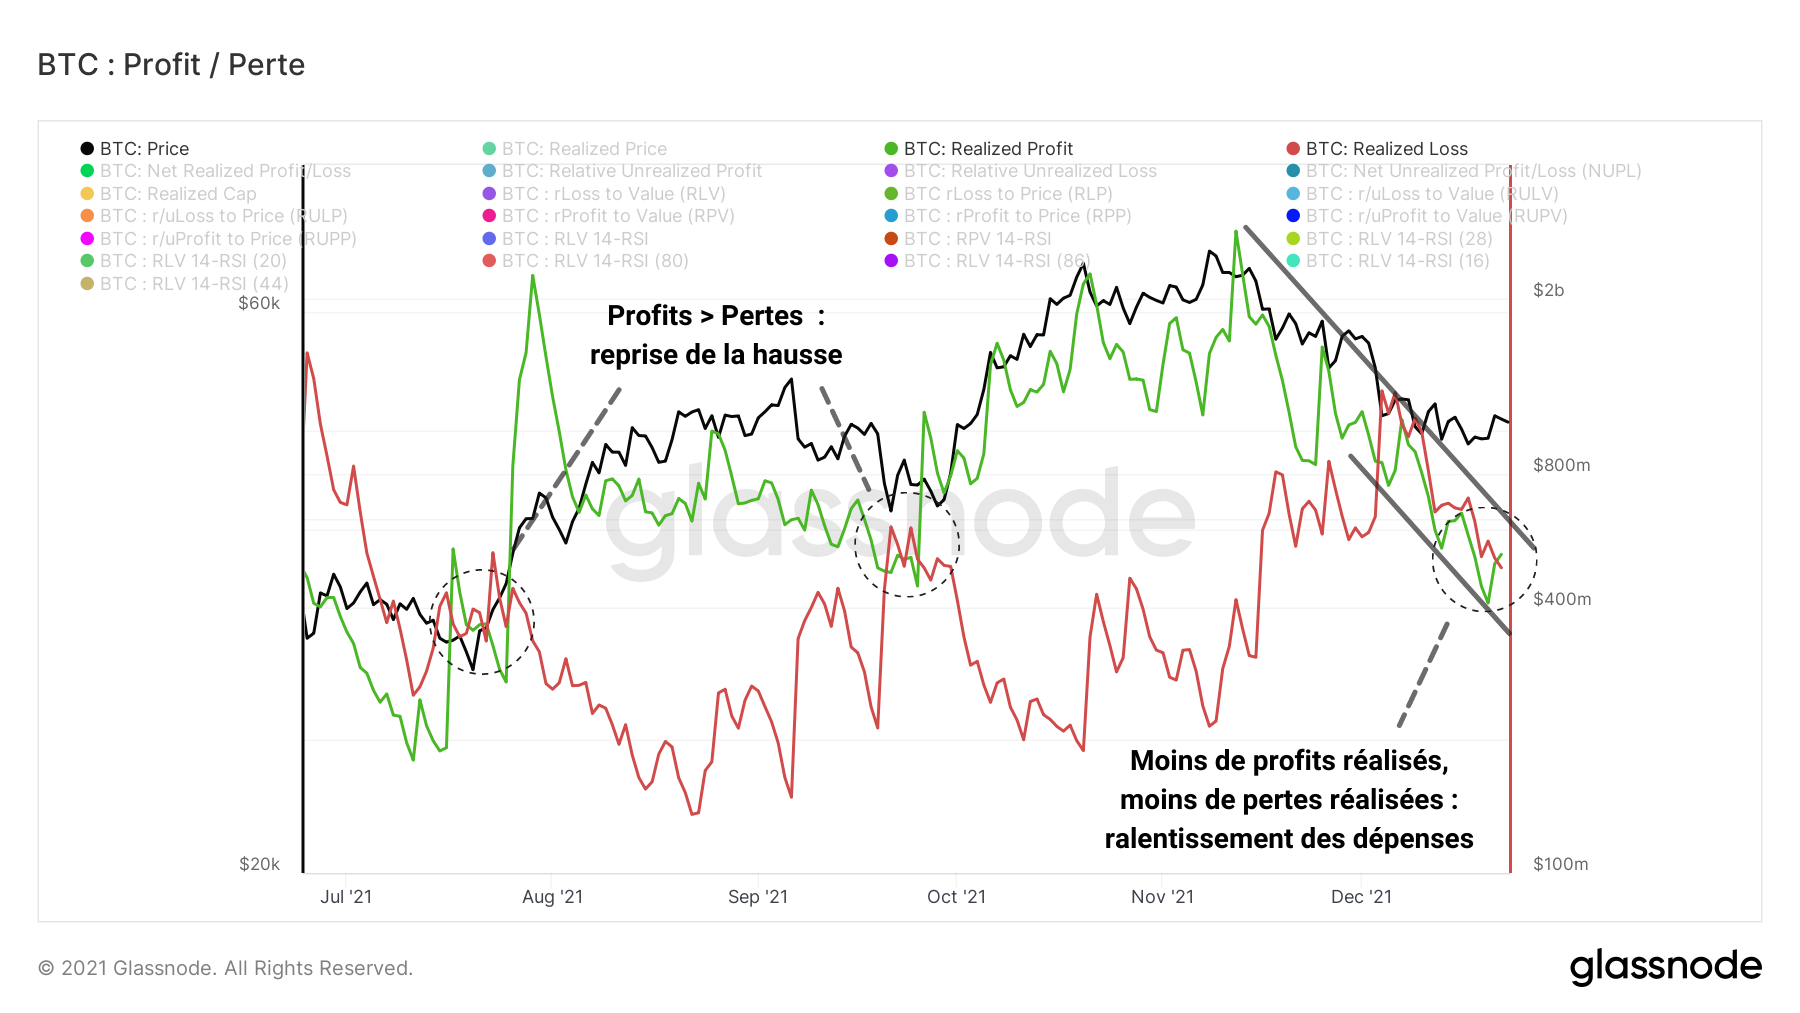
Bitcoin realized profit and loss graph (BTC) – Source: Glassnode
We are approaching the point at which the market, if spot demand exceeds selling pressure, could see realized profits exceed losses and enter a new phase of upside.
Indeed, after a period of strong pain induced in part by the cascades of liquidations identified several weeks ago, the total net realized profit / loss (NRPL) seems ready to return to positive values. This indicator, adding the two data mentioned above, establishes a daily profitability report.
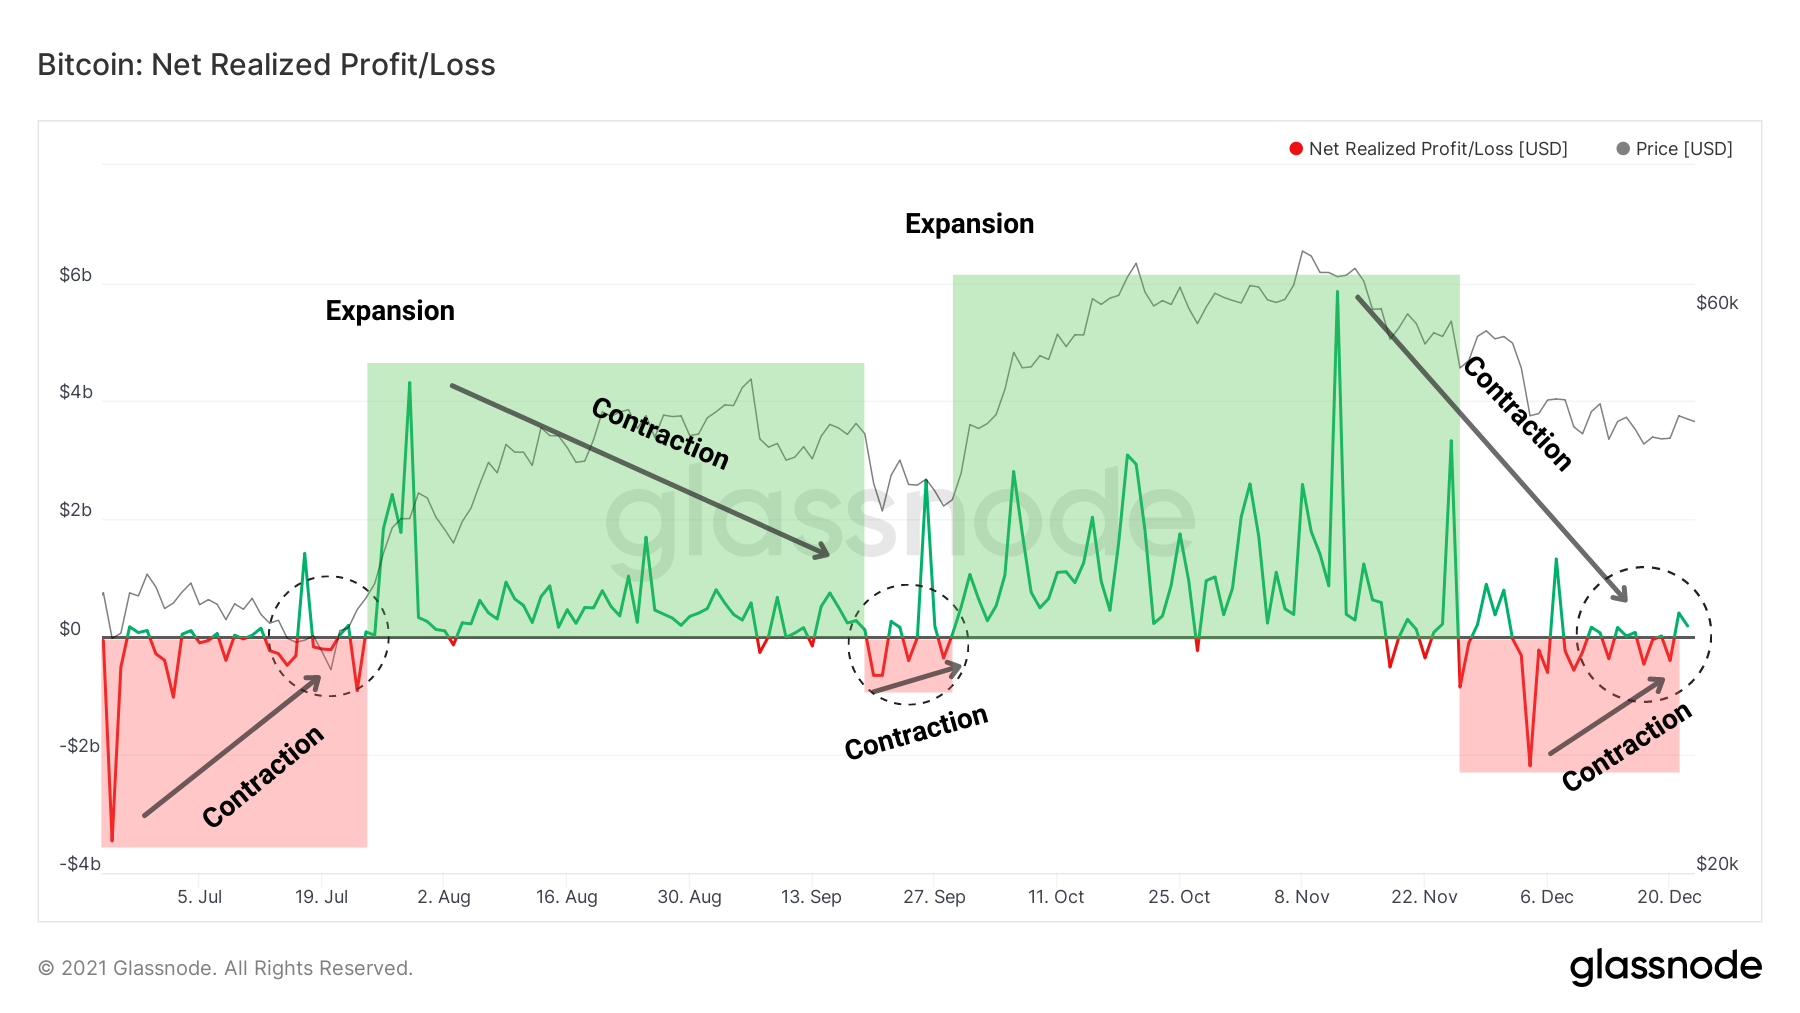
Bitcoin NRPL chart (BTC) – Source: Glassnode
By observing it more closely, it appears that expansion and contraction movements are emerging and make it possible to identify changes in the trend of this indicator over the medium term.
Concretely, the fall in losses and realized profits is reflected here by a contraction of the indicator around 0, which will give the direction of the state of profitability of the market within the next few days.
At this point, the market may:
- return to a state of increasing profitability (NRPL> 0 and tests 0 as support) and resume a gradual increase;
- realize more losses than gains (NRPL <0 and tests 0 as resistance) and risk a panic of the most fragile entities which could generate a capitulation.
Decrease and convergence of spending
What’s more, the recently spent tokens appear to be getting younger . Clearly, the majority of bitcoins sold since last week were under three months old.
This behavior, illustrated by the age bands of UTXO s releases, indicates that long-term holders have participated little in the selling pressure highlighted since the ATH of $ 69,000.
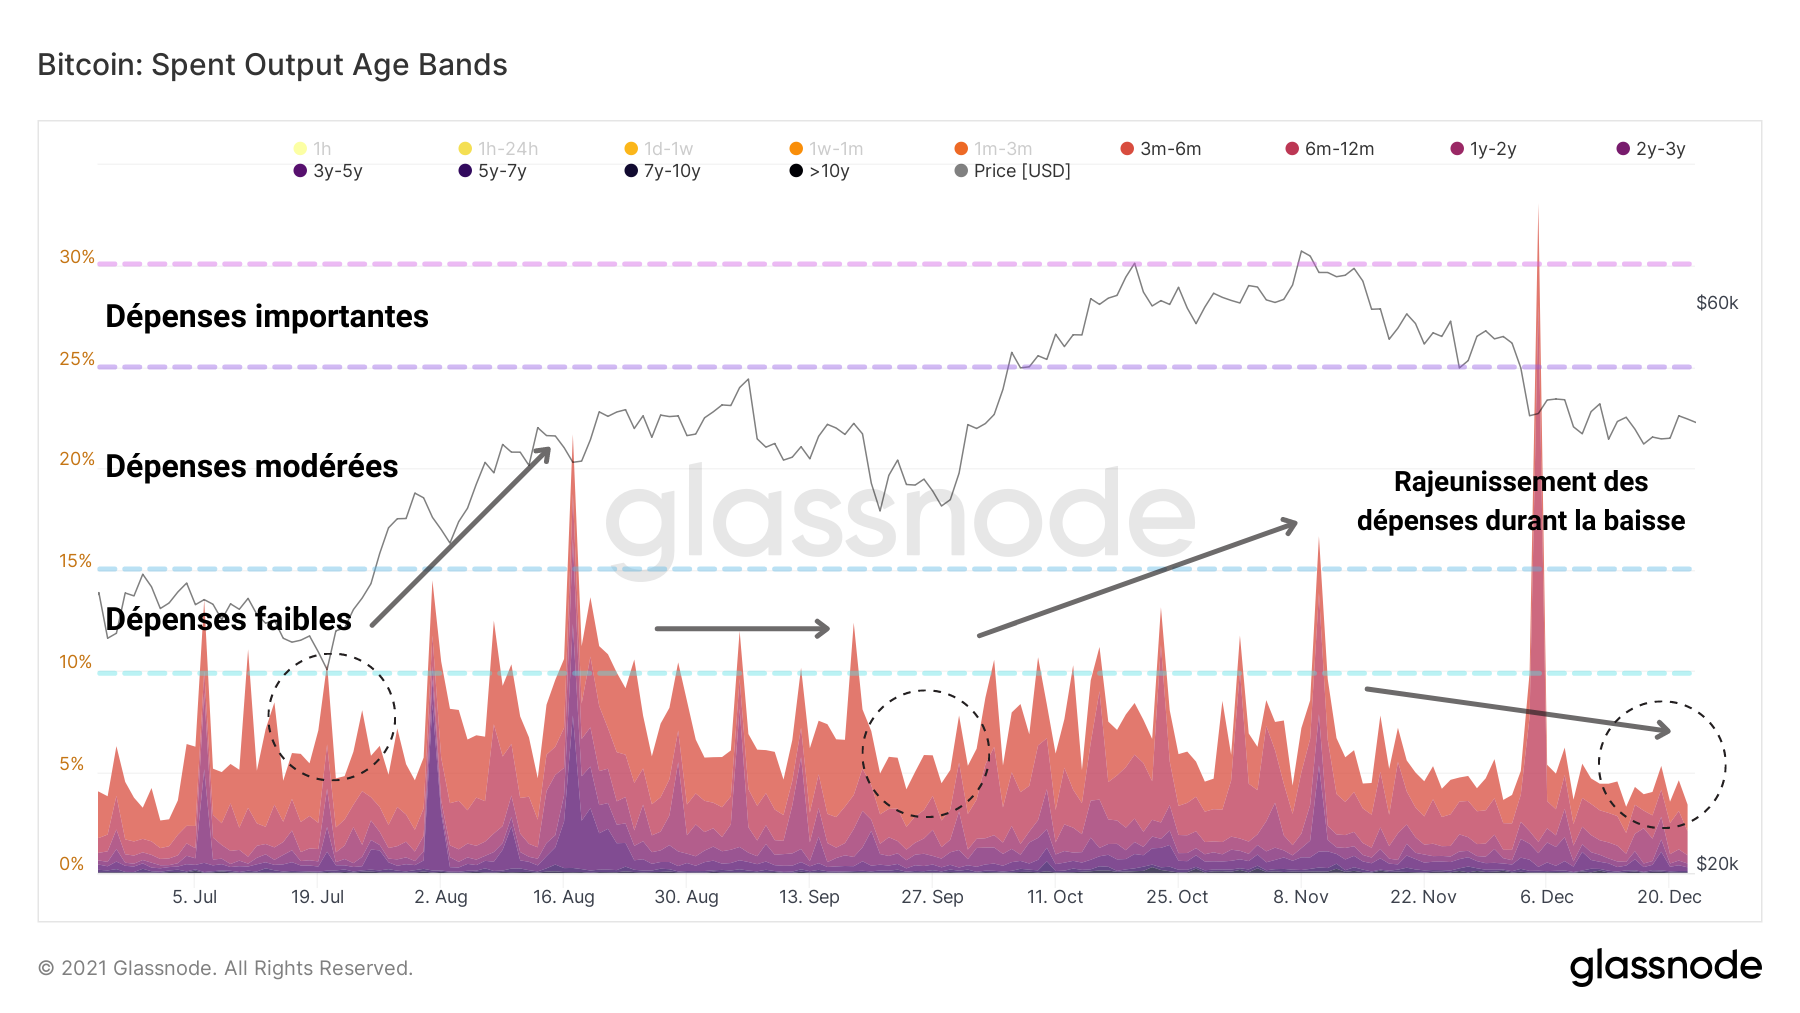
Bitcoin (BTC) SOAB chart – Source: Glassnode
So it was the short-term investors who influenced the short-term price action by selling tokens below their purchase price.
The Destroyed Token Days (JJD) count confirms this observation: Fewer and fewer mature tokens have been liquidated .
This downward trend, which has been in place for several months, demonstrates the desire of long-term holders (LTHs) not to leave the market despite the correction.
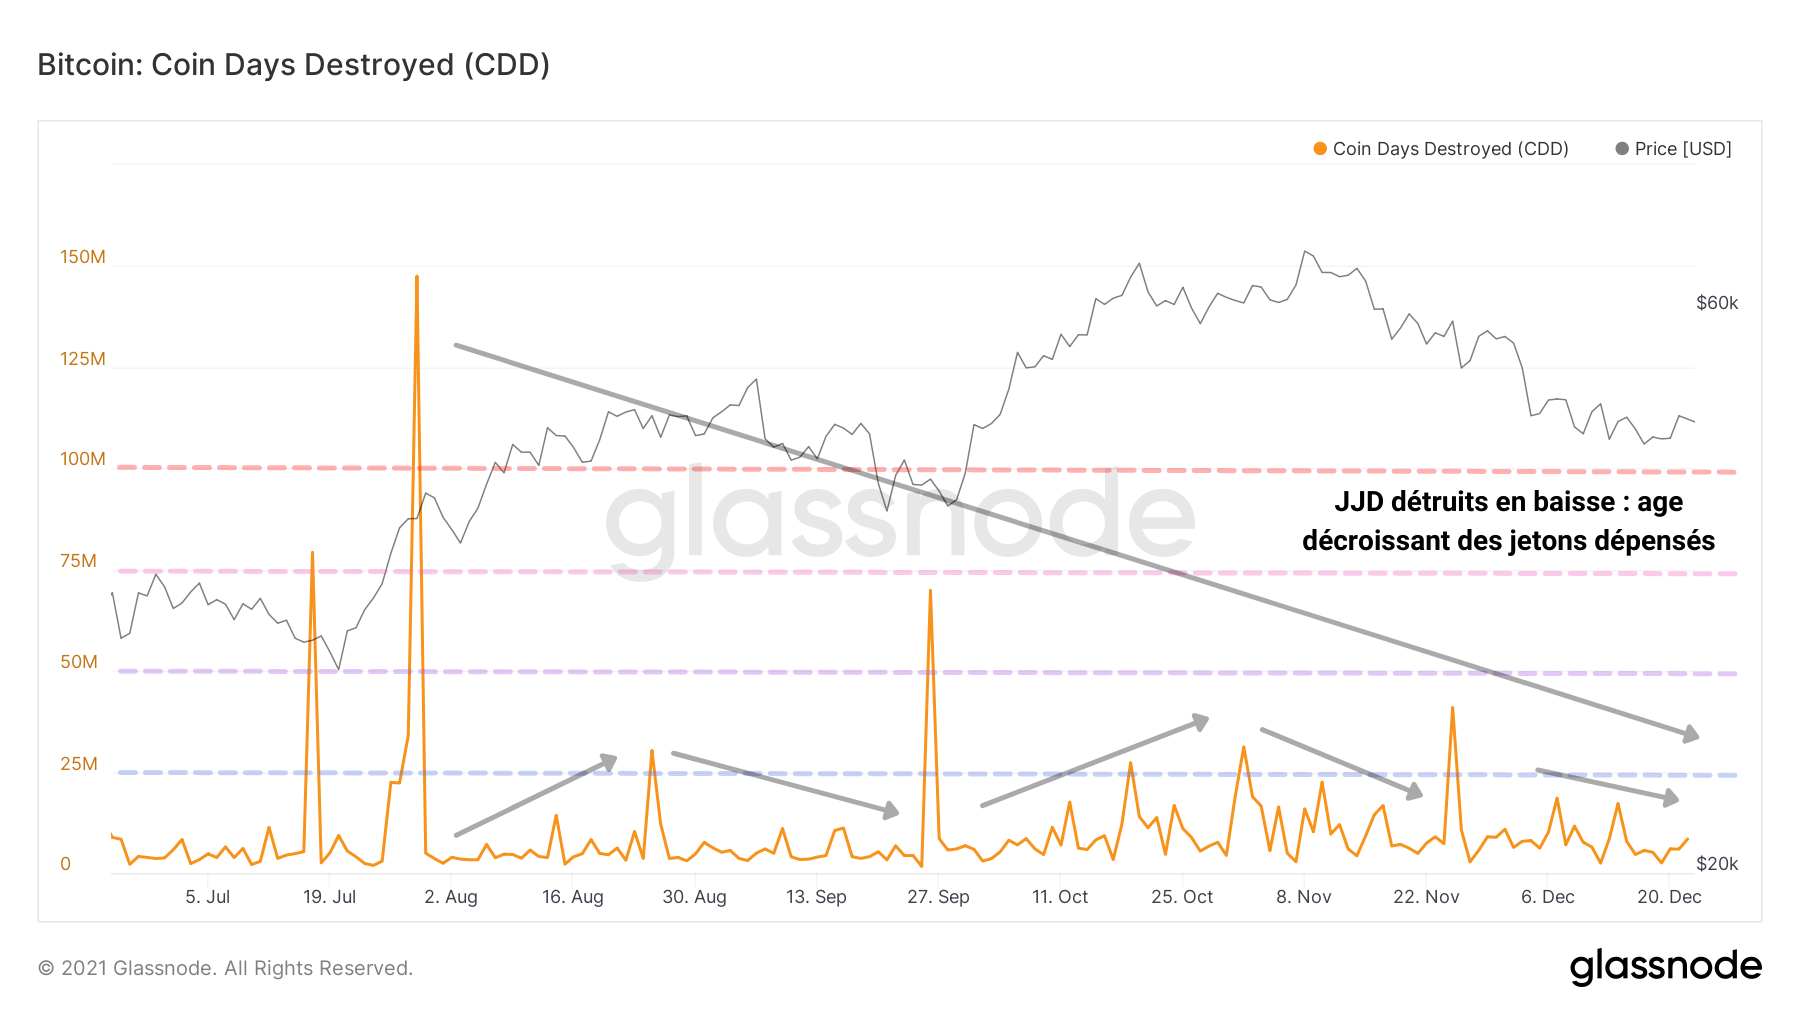
Bitcoin (BTC) JJD Account Chart – Source: Glassnode
This observation is corroborated by a decreasing liveliness . The liveliness is defined as the ratio between the sum of the destroyed DDs and the sum of all the DDs ever created. This indicator increases as long-term holders liquidate their positions and decreases as they accumulate.
We can thus recognize that as a cohort, the whole of the LTHs favors the saving with the expenditure since the DDs destroyed increase less than the DDs created.
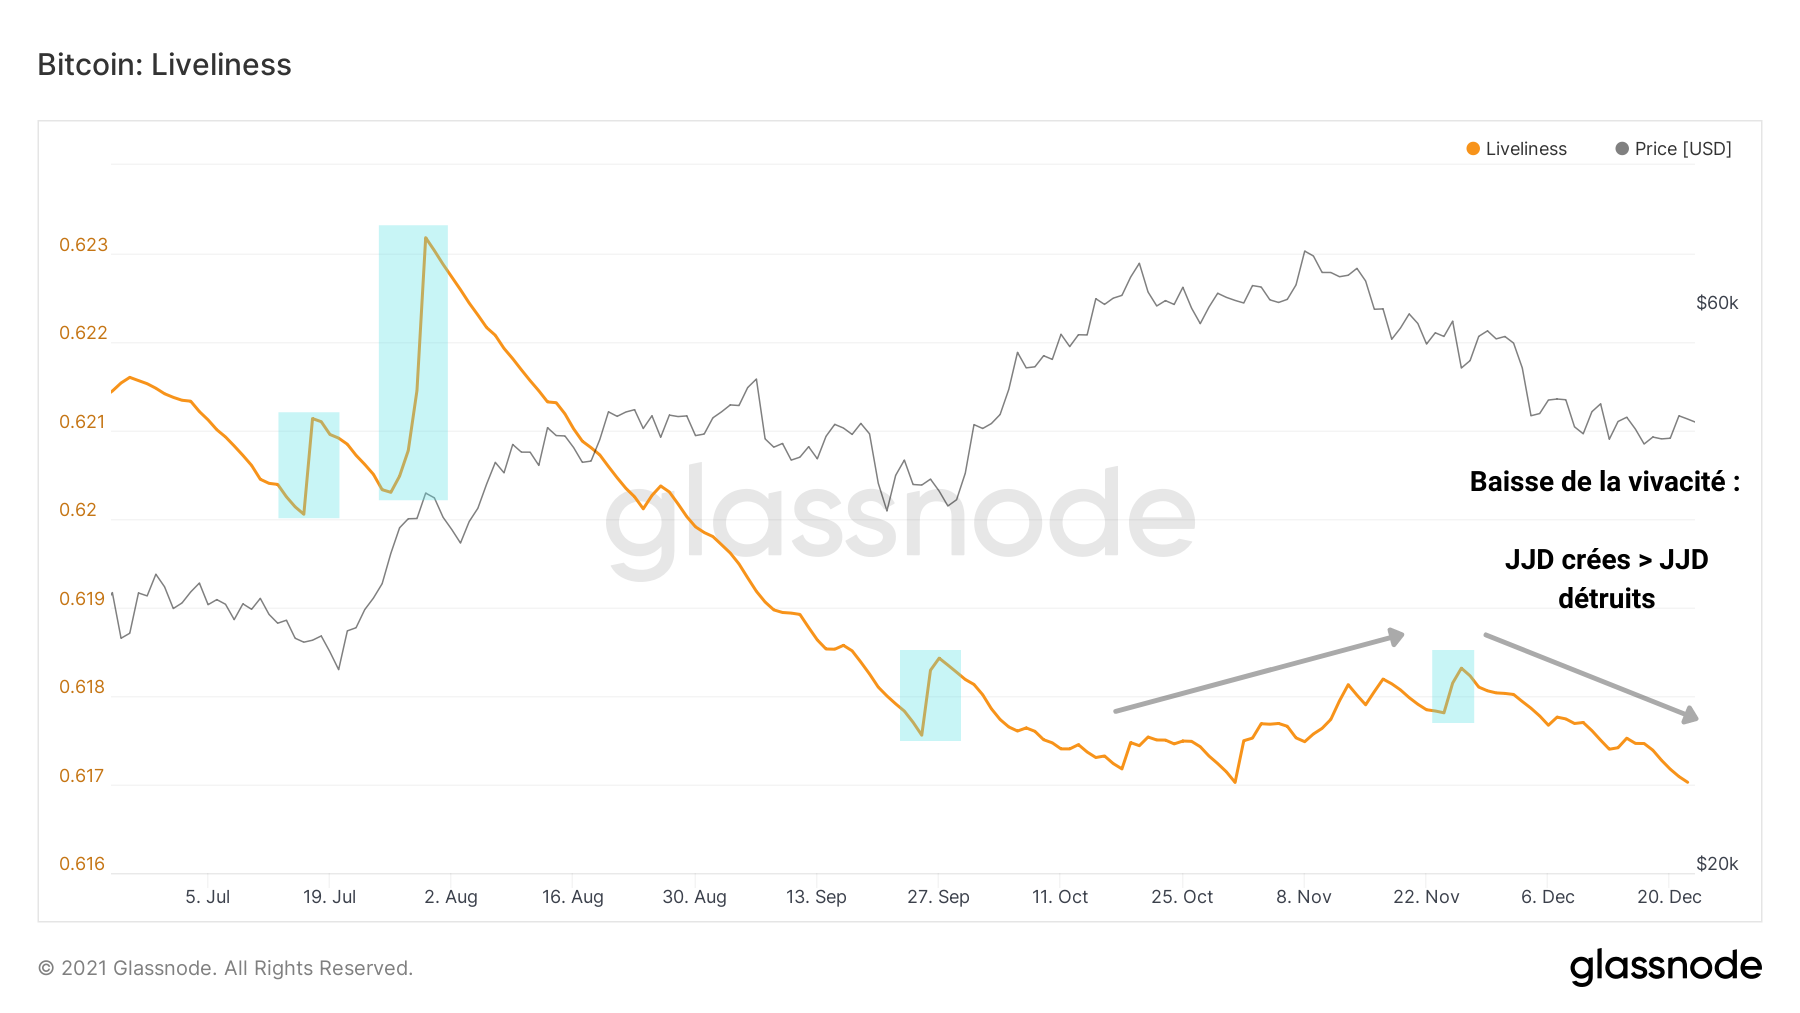
Bitcoin Vividness Chart (BTC) – Source: Glassnode
In short, the trickle-down spending behavior of LTHs, described last week , could fade by the time of the next publications if long-term investors decide to skim trade reserves again.
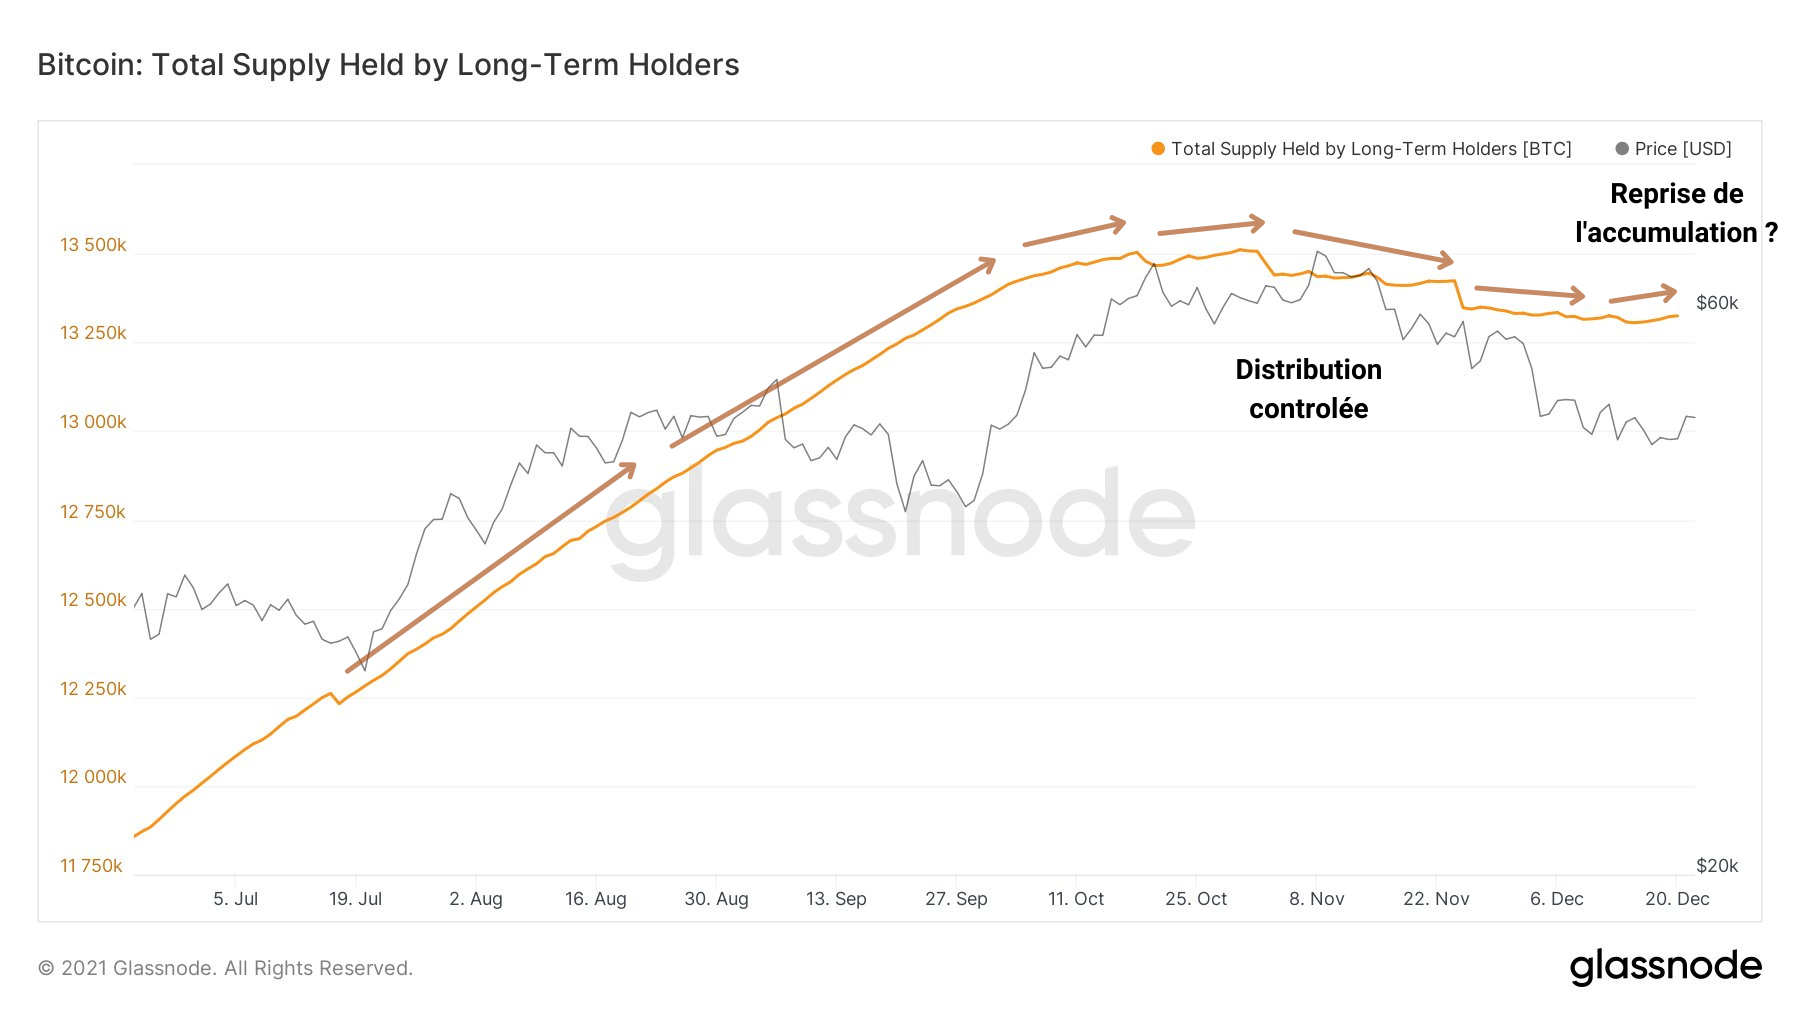
Graph of the offer held by LTHs – Source: Glassnode
It is also likely that some of them took advantage of recent sales to accumulate more BTC. Thus, the process of distributing LTHs to STHs , a transfer dynamic typical of bull markets, could be postponed for several weeks or even months.
However, it should be noted that the current underlying market dynamics include new aspects that only long time and hindsight will allow us to grasp.
A decisive momentum
Let’s talk about market momentum. Momentum is the momentum , the fluctuating inertia of the market over time.
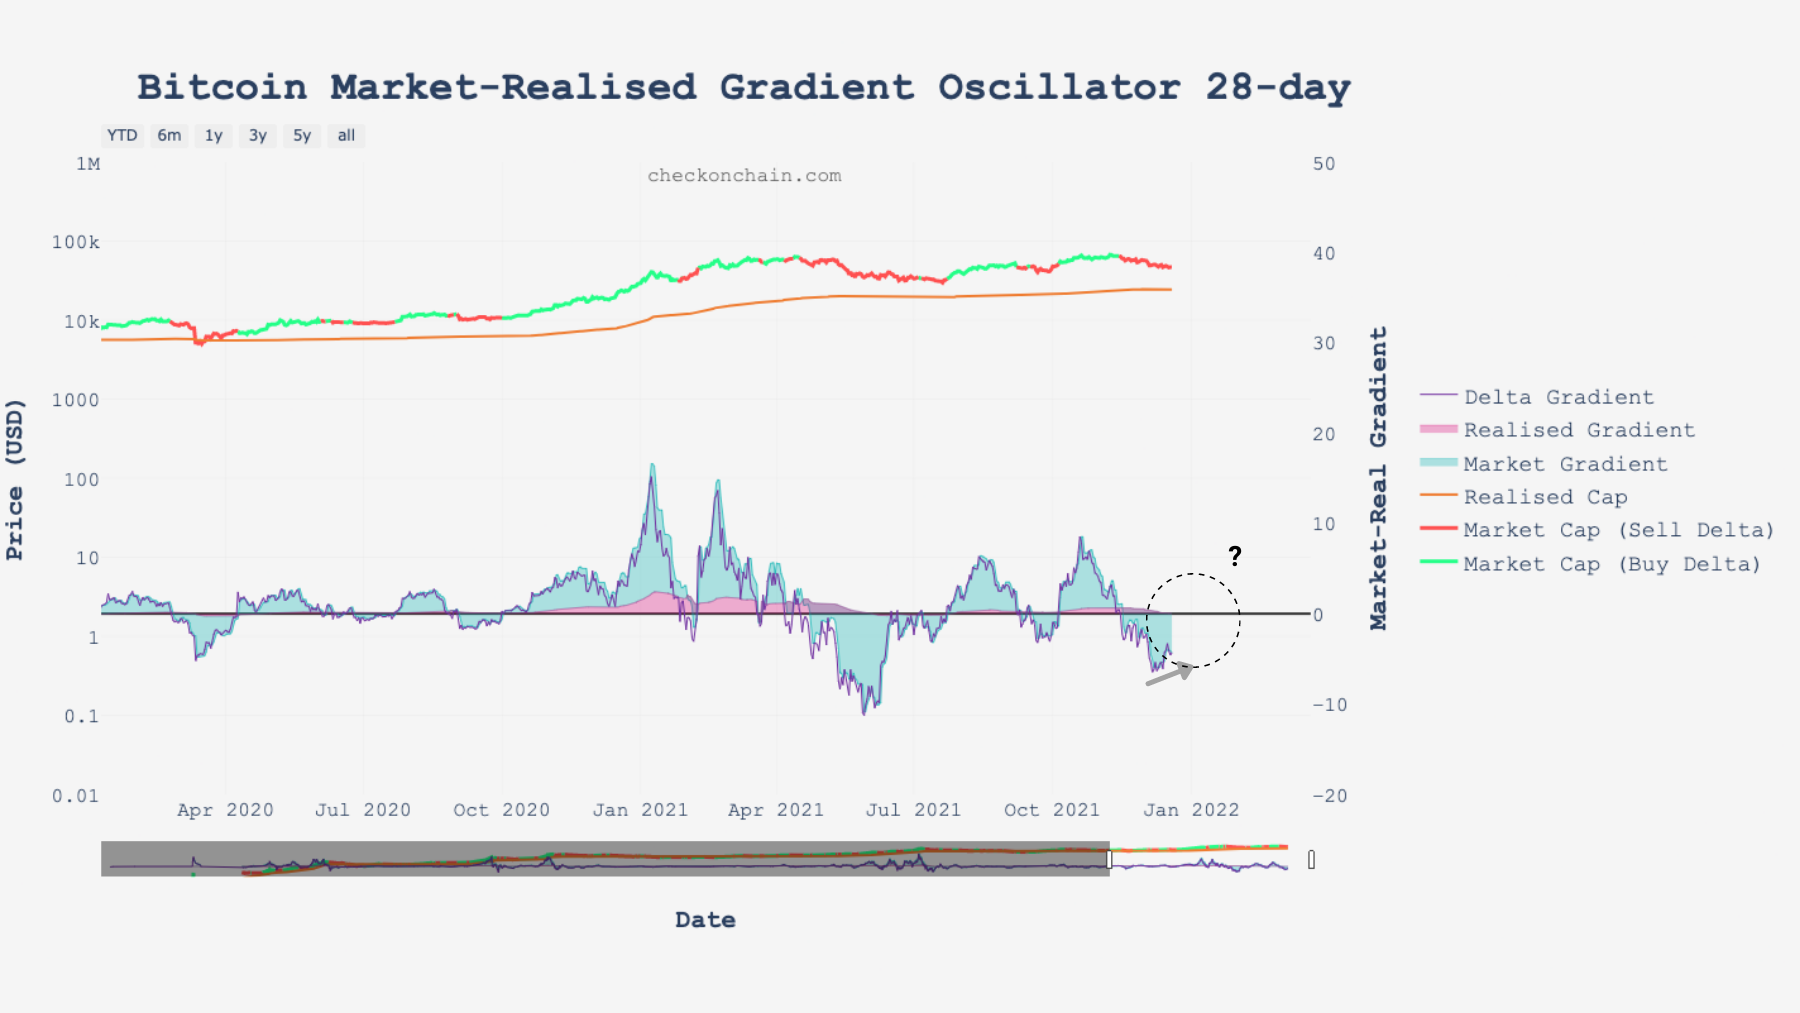
Presented here on three time scales (14 days, 28 days and 140 days), the MRG or realized market gradient (in purple) measures the inclination or verticality of the price of bitcoin (BTC).
It can be roughly interpreted as follows:
- It measures market momentum in order to gauge the power of a movement .
- Higher or deeper peaks mean more vertical and fuller movements.
- An increasing price, coupled with successive new highs , implies more power with every move.
- A decreasing price, accompanied by negative peaks , indicates dissipation of momentum .
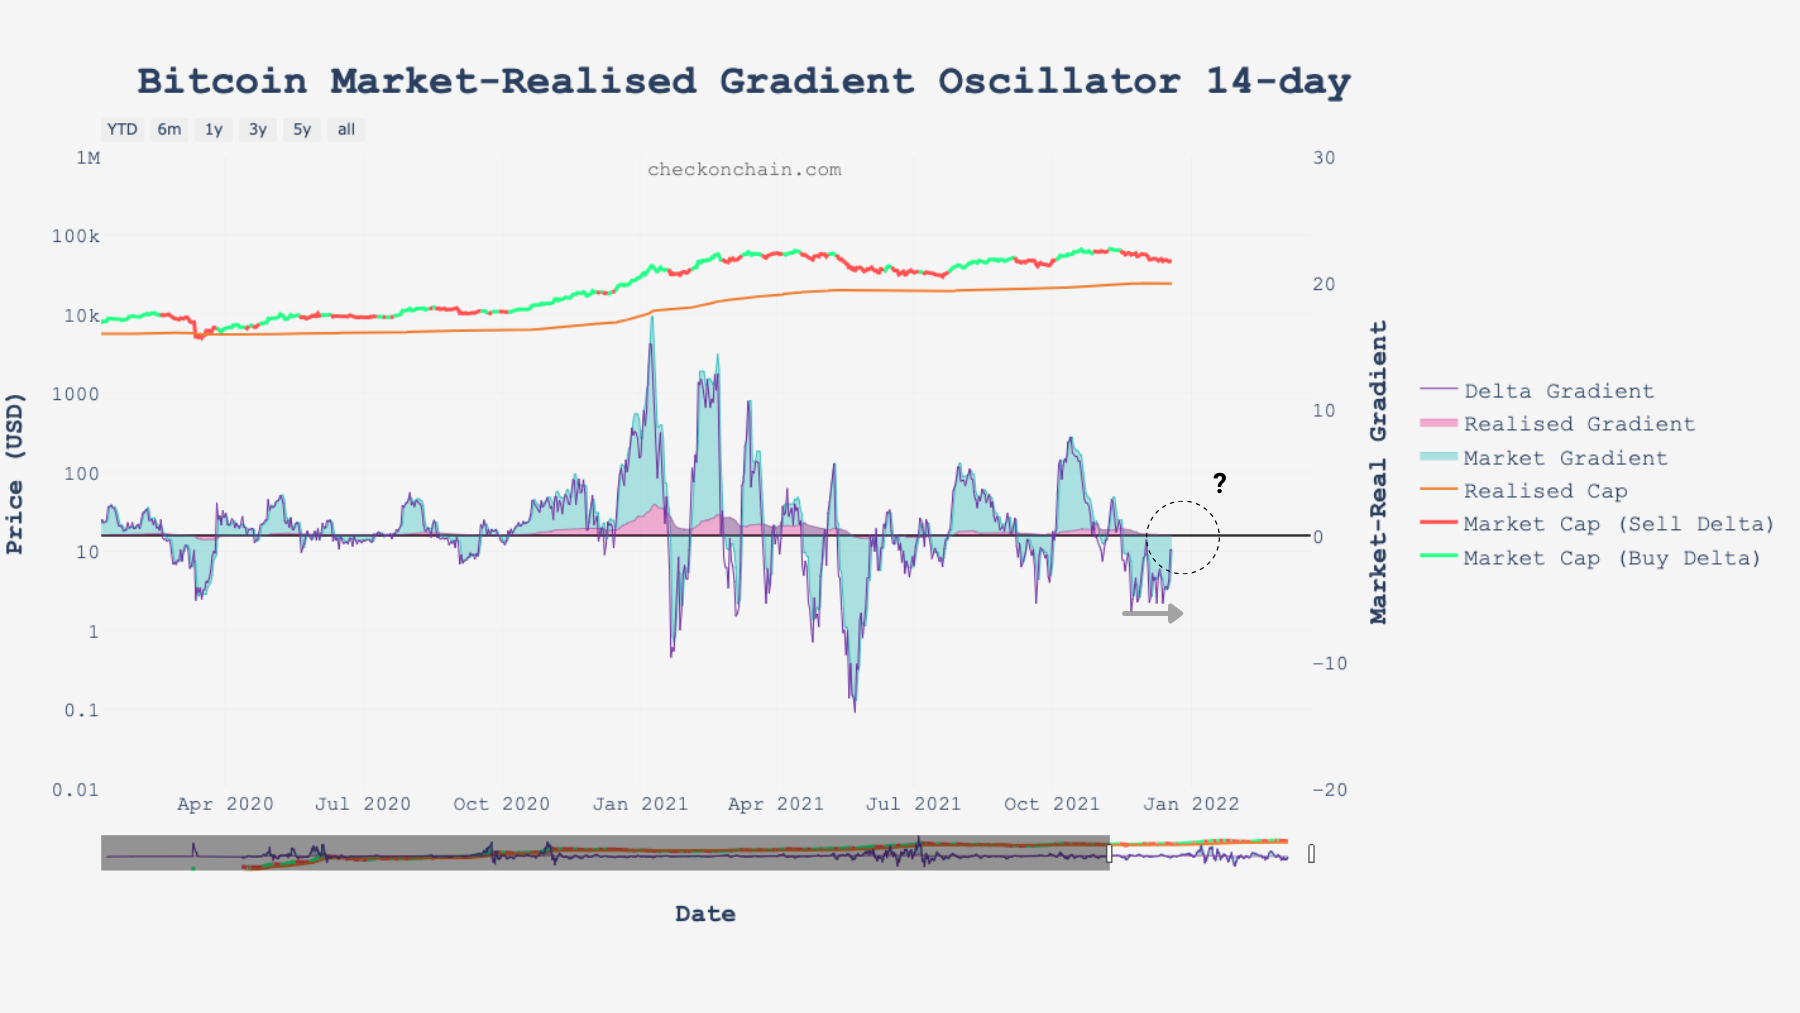
The MRG-14, observing the short-term, prints negative values but has just extricated from a lateralization.
Bitcoin (BTC) MRG-14 chart – Source: Glassnode
Despite bearish price action, the momentum is no longer weakening. Market inertia is stabilizing , which is constructive.
We need to see a breakout to the upside and then full confirmation above 0 to hope for a trend reversal.
On a monthly basis, the MRG-28 barely bounced back. It marks a lower point higher than the previous one, synonymous with a recovery which will also have to be confirmed in the coming weeks.
Bitcoin (BTC) MRG-14 chart – Source: Glassnode
The 140-day gradient, capturing the underlying market momentum, is an oscillator and a useful trend signal for long-term investors.
It is currently approaching major support which also tends to be reached when market momentum is in one of two situations:
- On the verge of a strong rebound on bull market support;
- About to enter a winter, a bear market .
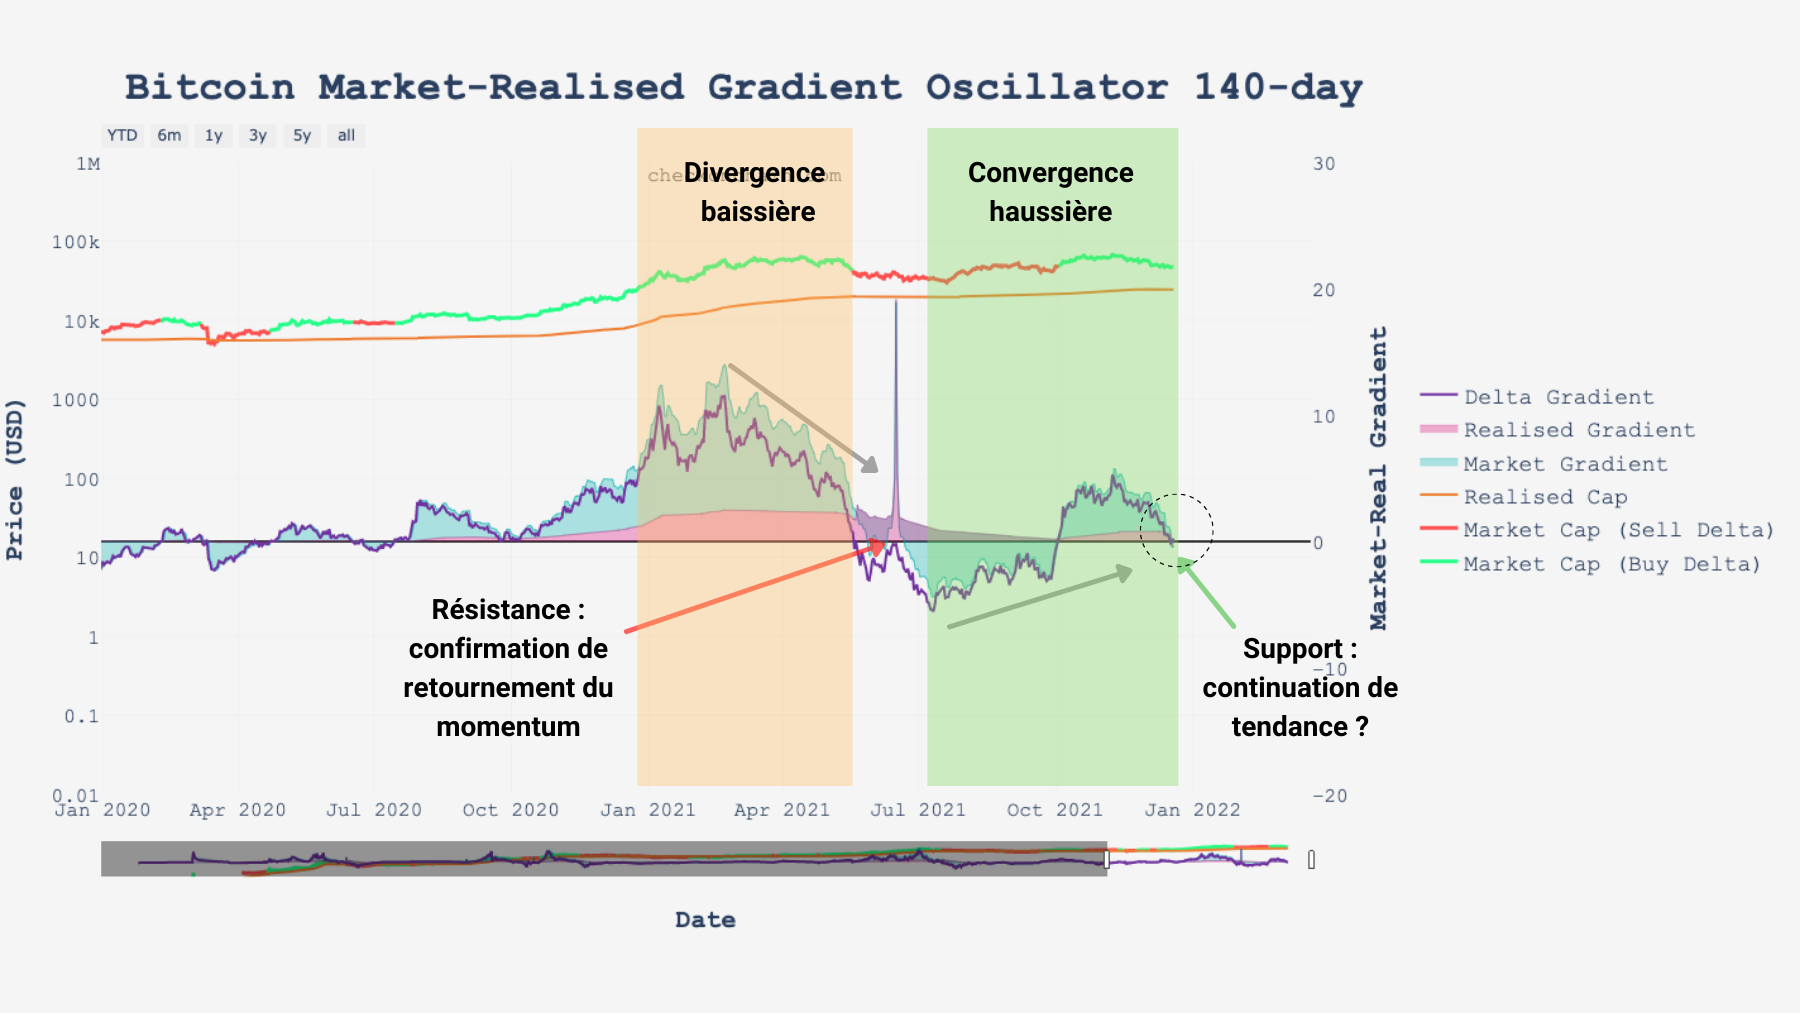
Bitcoin (BTC) MRG-14 chart – Source: Glassnode
Although these signals may seem contradictory, it would be useful to observe a confluence of the different gradients in order to have a probable glimpse of the next trend.
Synthesis
Finally, the study of expenses tells us that realized losses slow down as long-term holders control their distribution, and may initiate a continuation of the range in the short term.
With price momentum about to test strong support , it would be appropriate to see bitcoin (BTC) break free from the 21 eMA daily and stay above $ 52,000 by the next. next two weeks.