Bitcoin (BTC) holds the $40,000 mark. As the market consolidates again, the spending behavior of participants indicates a willingness to accumulate and save BTC without hinting at a bullish bias. With a third of the supply in a state of latent loss, the selling pressure is significant and a more pronounced drop in price is not an impossible scenario. On-chain analysis of the situation.
Bitcoin holds the $40,000 mark
The price of Bitcoin (BTC) is hovering around the $40,000 support and adopting a particularly indecisive price structure .
In a state of consolidation throughout the first quarter of 2022, bitcoin is however printing successive lows higher and higher, casting doubt on its short and medium-term trend for many investors.
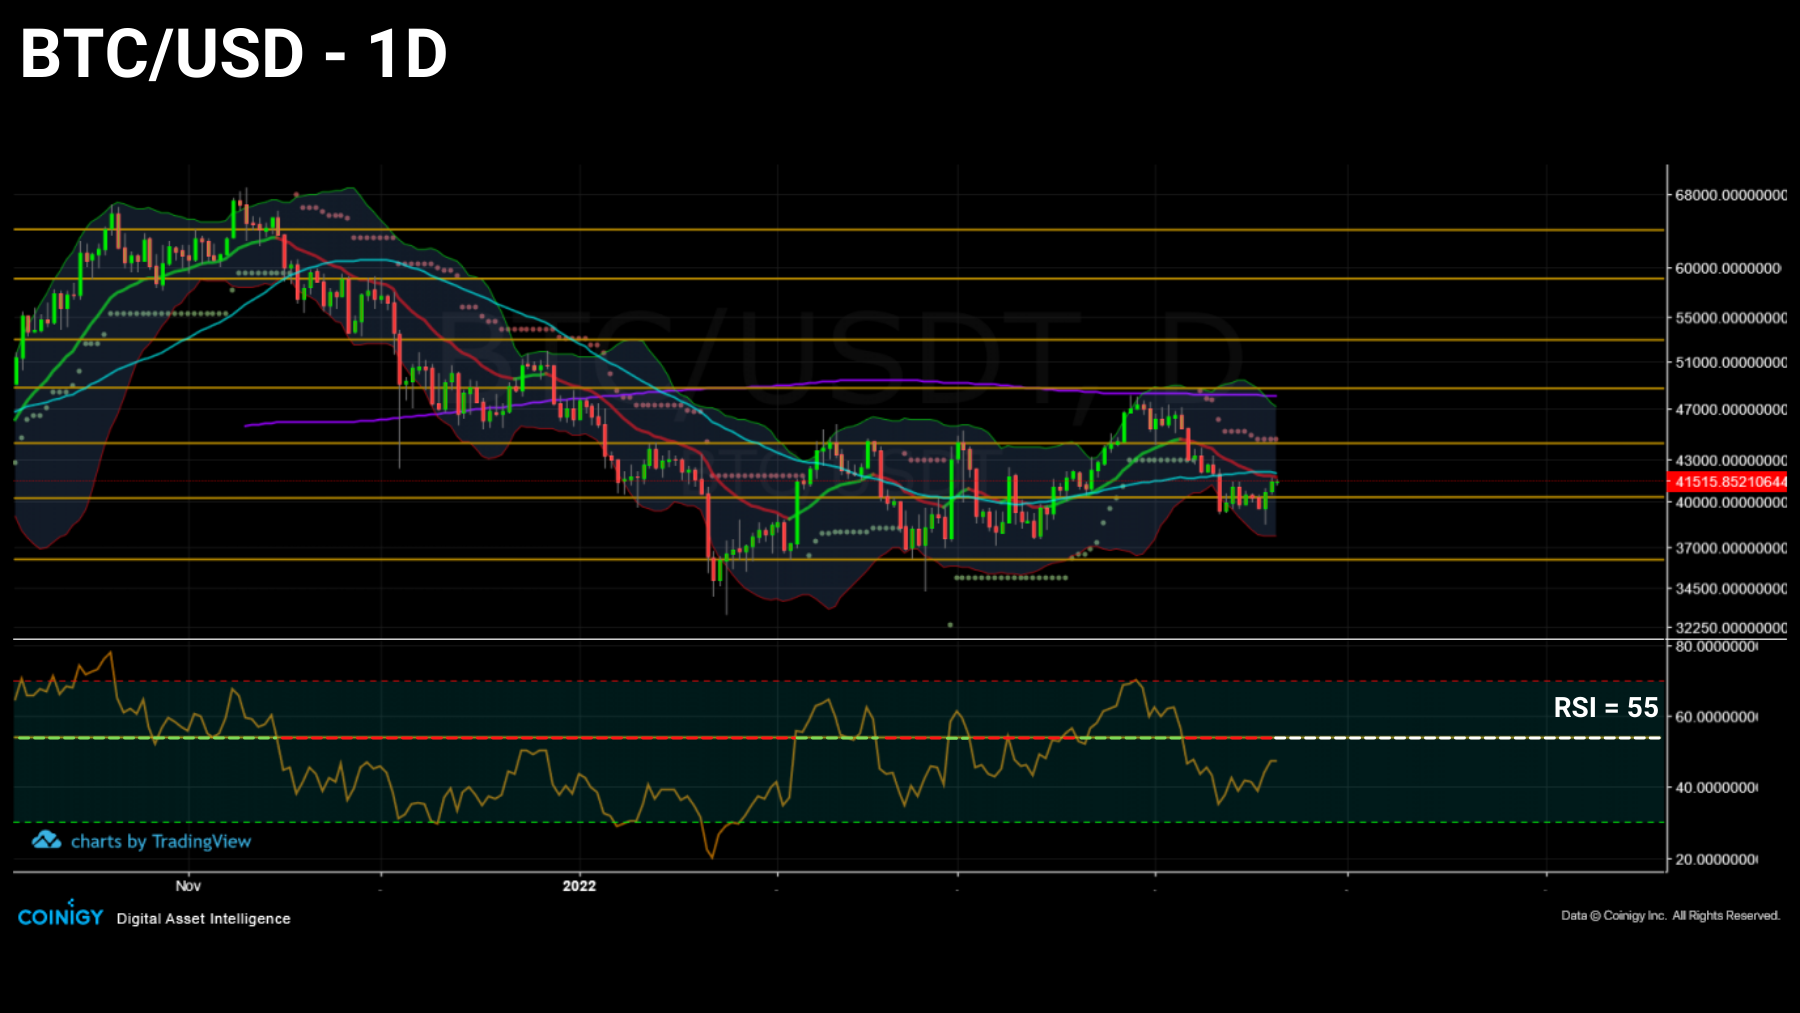
Figure 1: Daily price of Bitcoin (BTC)
This week, we will study the lifespan of the BTC spent then the state of profitability of the investors in the short and long term before addressing the security of the network and the behavior of the cohort of miners .
Age of expenses drops
Let’s begin this analysis by studying the count of Coin Days (JP) destroyed over the past few weeks.
Particularly effective in identifying the spending behavior of seasoned investors and HODLers, the graph below makes it possible to distinguish two distinct phases of spending:
- periods of strong JP destruction (green) indicate that old BTC is being spent with a view to taking profit and serving as catalysts during bull markets;
- periods of weak destruction of JP (red) are a sign of a rejuvenation of spending and reflect a savings behavior on the part of long-term investors.
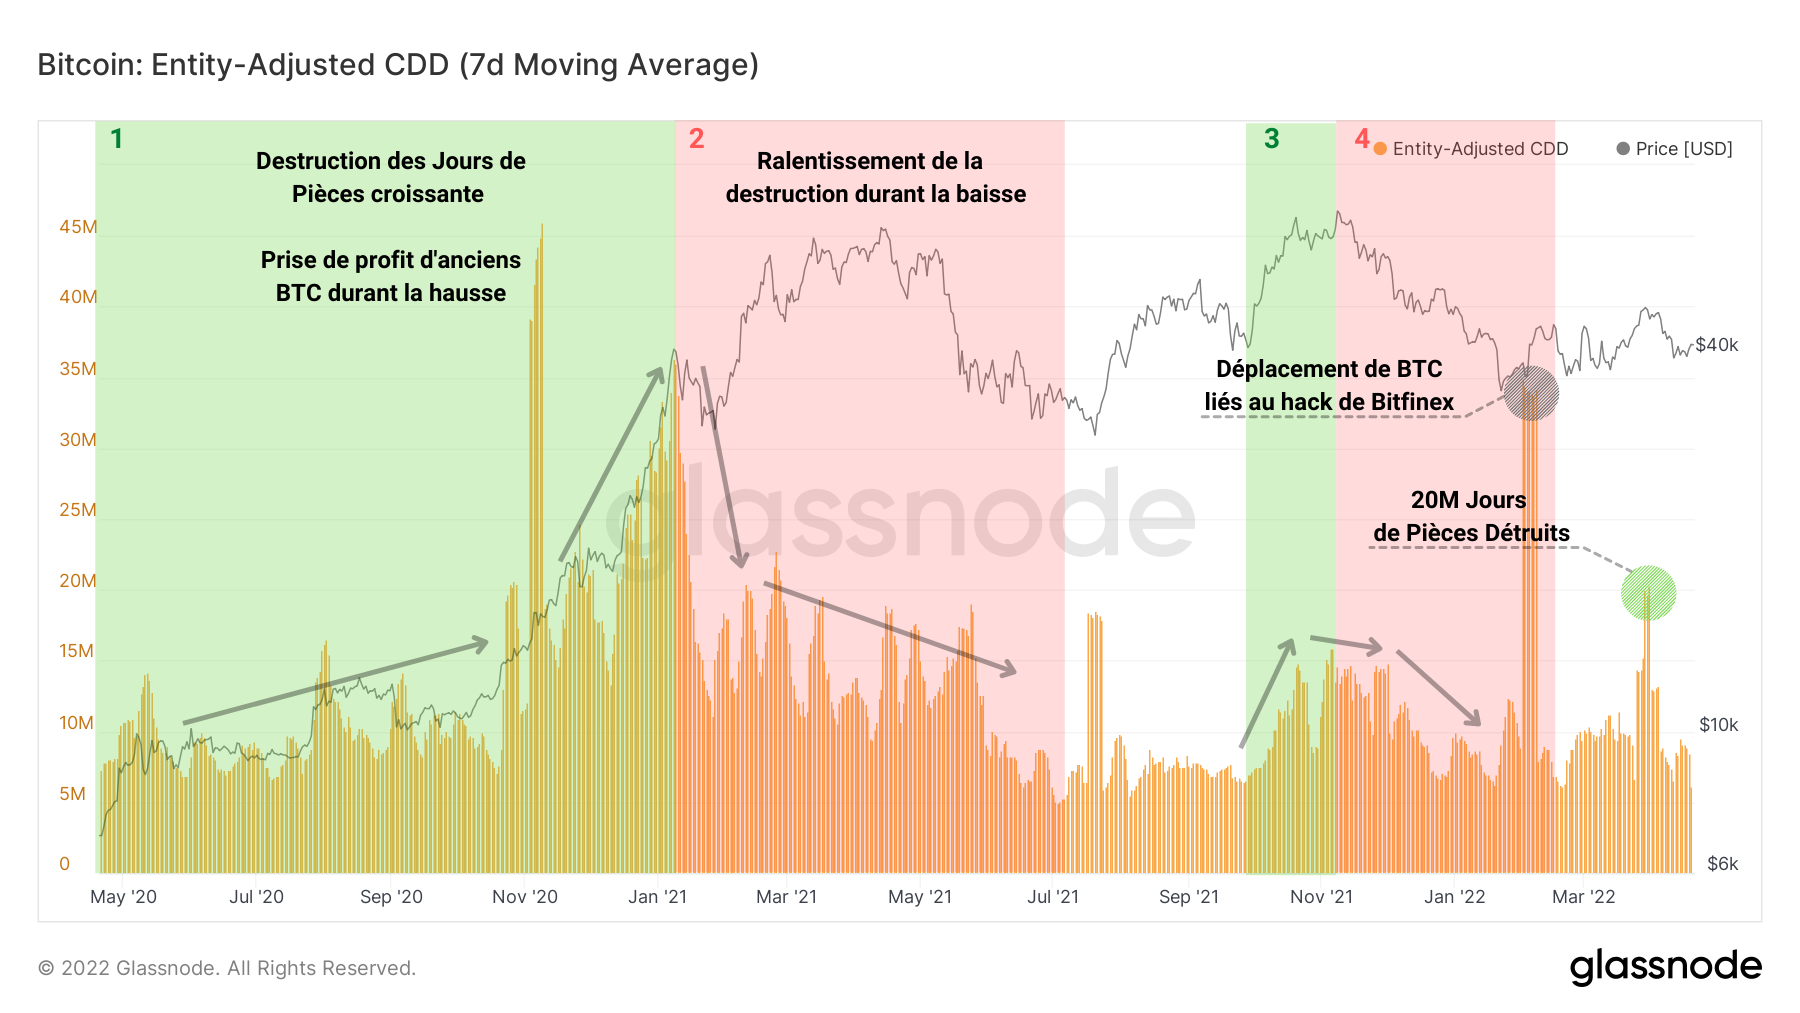
Figure 2: Days of Parts Destroyed
We can then notice that over the past few months the downtrend of JP’s destruction has eased. Additionally, during the recent rally that brought BTC back to near $50,000, there appeared a 20 million JPY spike in destruction indicating moderately aged spending .
The same behavioral pattern can be seen on the Volume Spent Age Bands (SVAB) chart, where however it can be observed that spending of bitcoins older than 6 months has been steadily declining since March 2022.
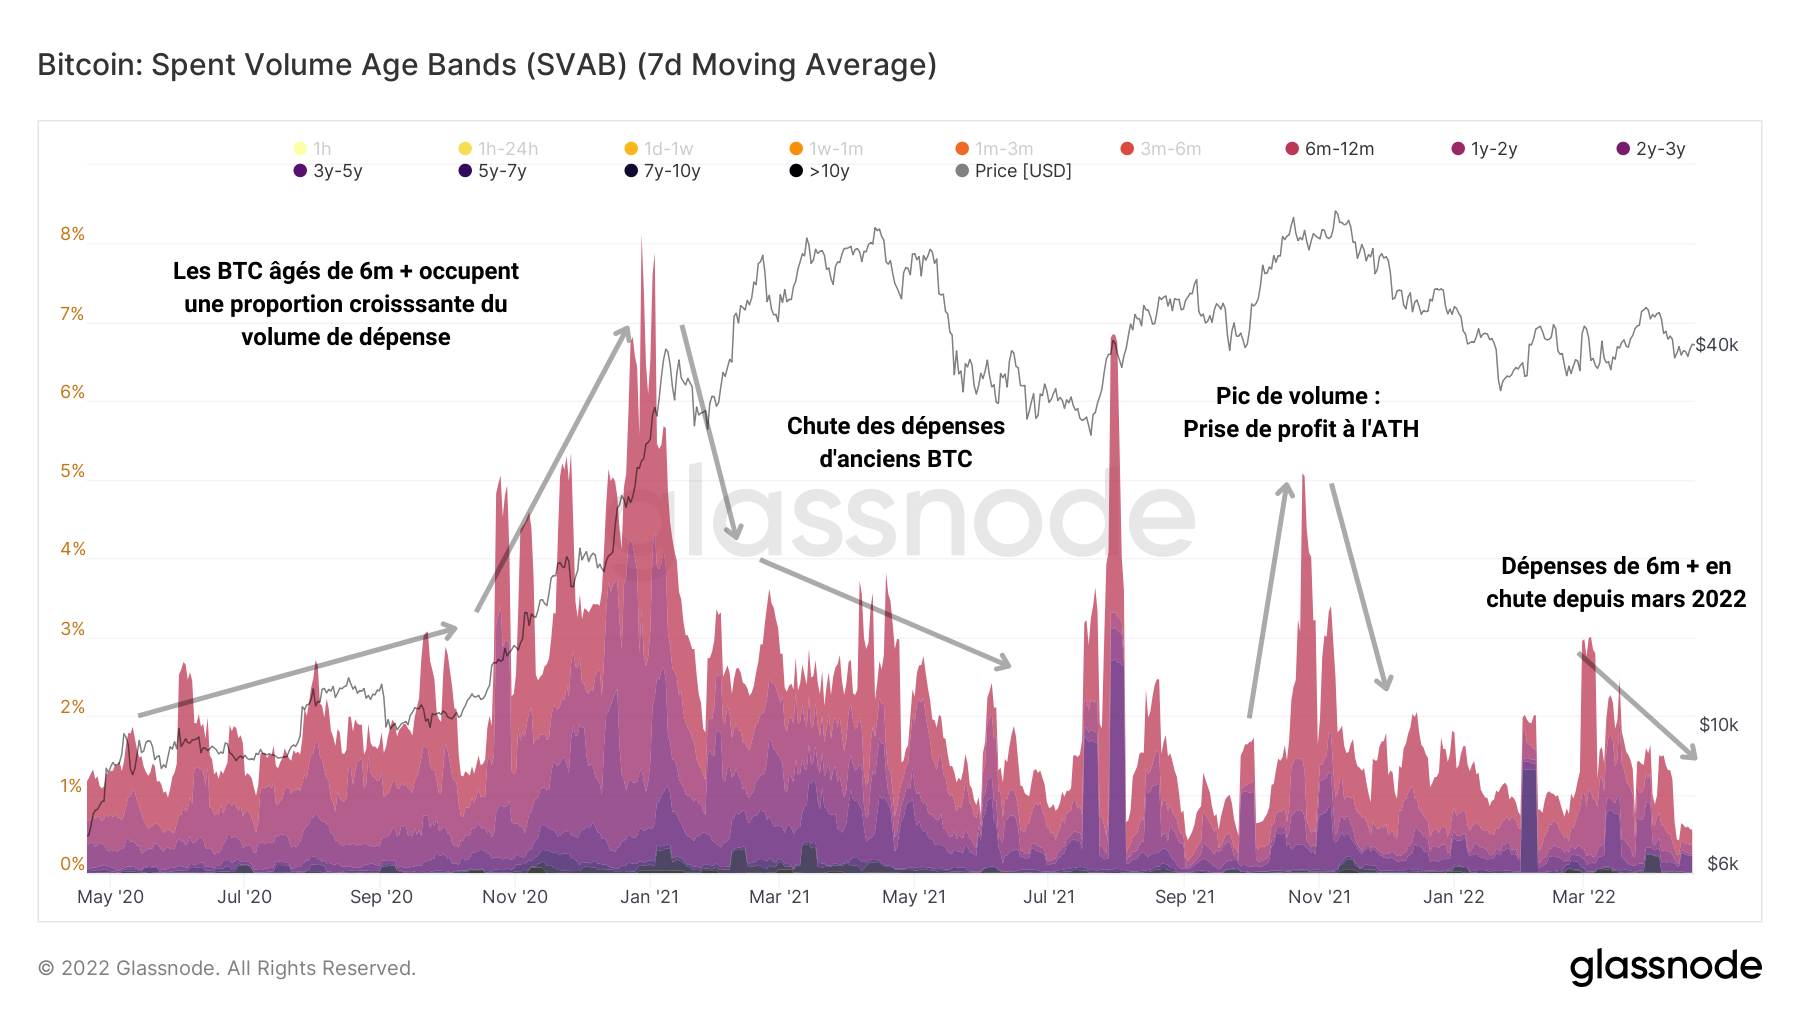
Figure 3: Volume Spent Age Bands (SVAB)
It therefore seems that the peak of destruction mentioned above is an isolated phenomenon of spending and does not currently constitute an overall trend involving a large number of investors.
By referring to the average age of spent UTXOs, named ASOL, we can further support this thesis. ASOL is a service life indicator that works as follows:
- high values and increases indicate that the average age of spending is high , a sign that long-term investors are spending their holdings;
- low values indicate that the majority of UTXO spent is young and immature .
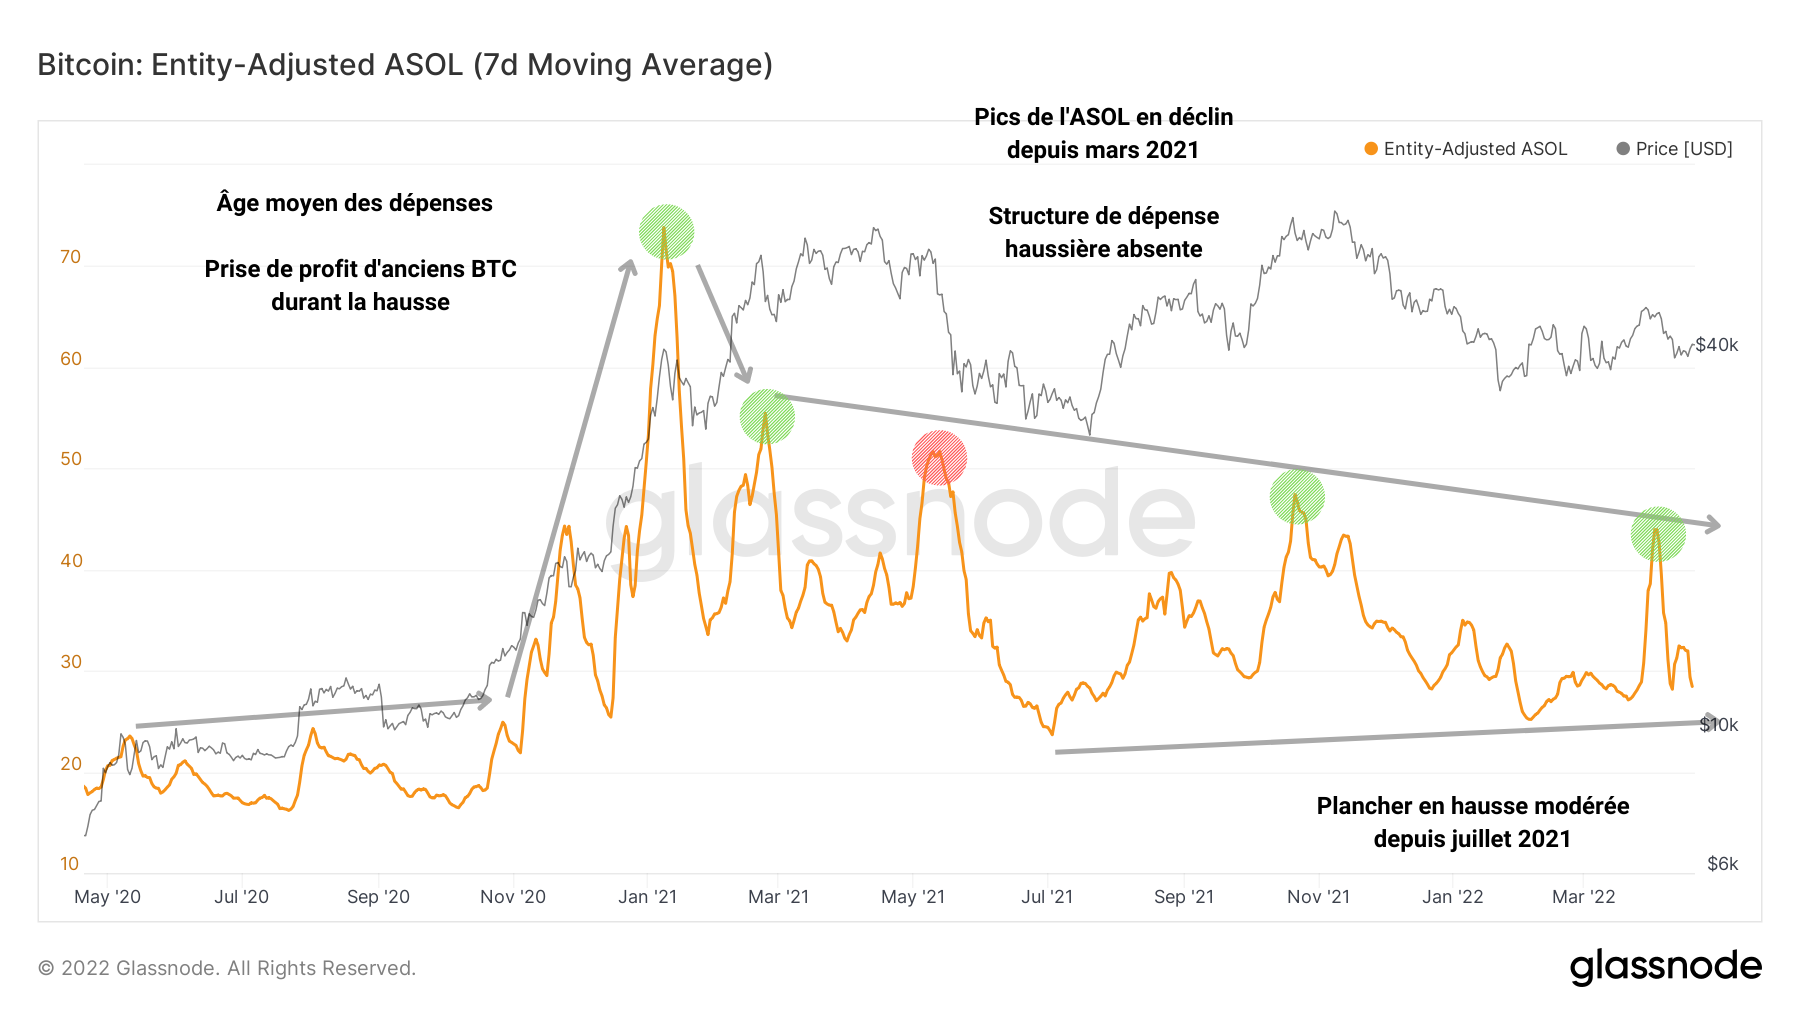
Figure 4: Average Age of UTXOs Spent (ASOL)
We therefore find a similar rise in ASOL at the end of 2020 and the beginning of 2021, followed by a constant decline in the peaks indicating an absence of an identifiable bullish spending structure .
Corroborating the previous elements, liveliness , defined as the ratio between the sum of JPs destroyed and the sum of all JPs ever created, continues to fall, a sign that accumulation remains the dominant behavior within the market.
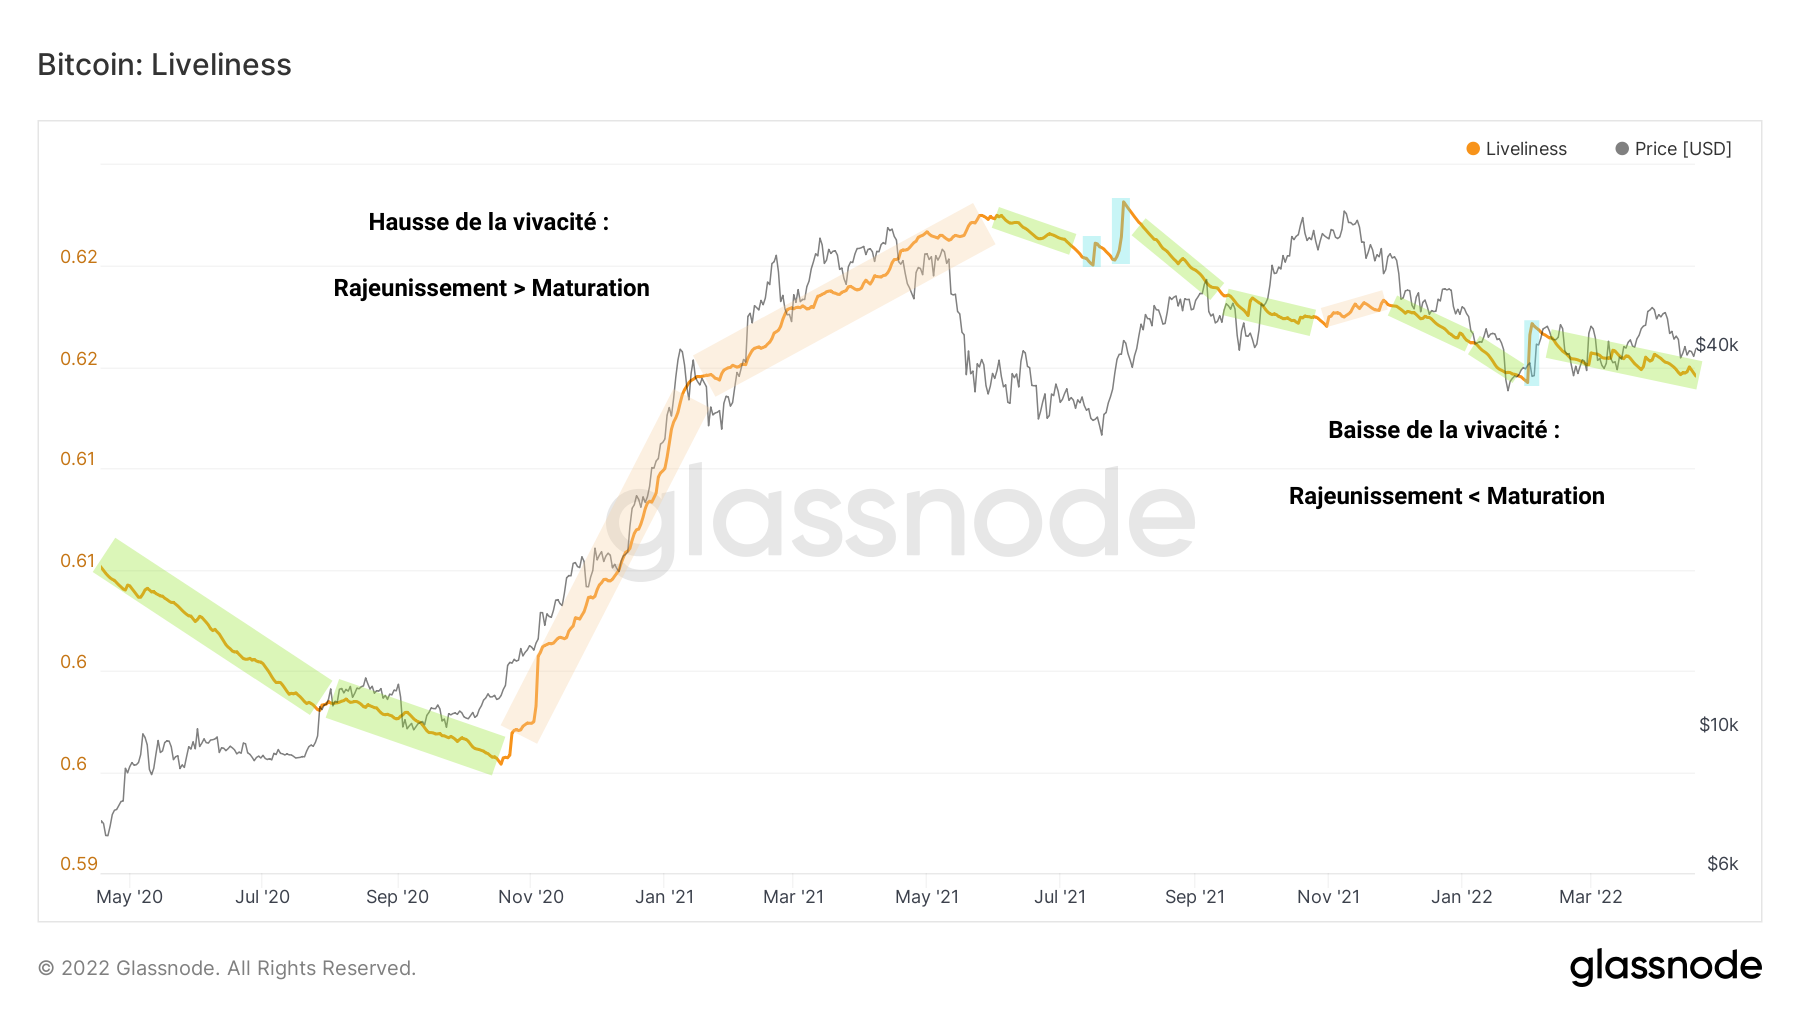
Figure 5: Liveness
A third of the market in a state of loss
Let’s then turn to the metrics relating to the state of profitability of the market and its cohorts. Essential tools, they make it possible to gauge the extent of selling or buying pressure , but also the reactions of investors to market stimuli.
Let’s start by highlighting a salient fact: the estimated supply of BTC in circulation estimated in a state of loss (and therefore more likely to be spent) is now almost similar to that recorded during the final decline of the May-June 2021 capitulation. .
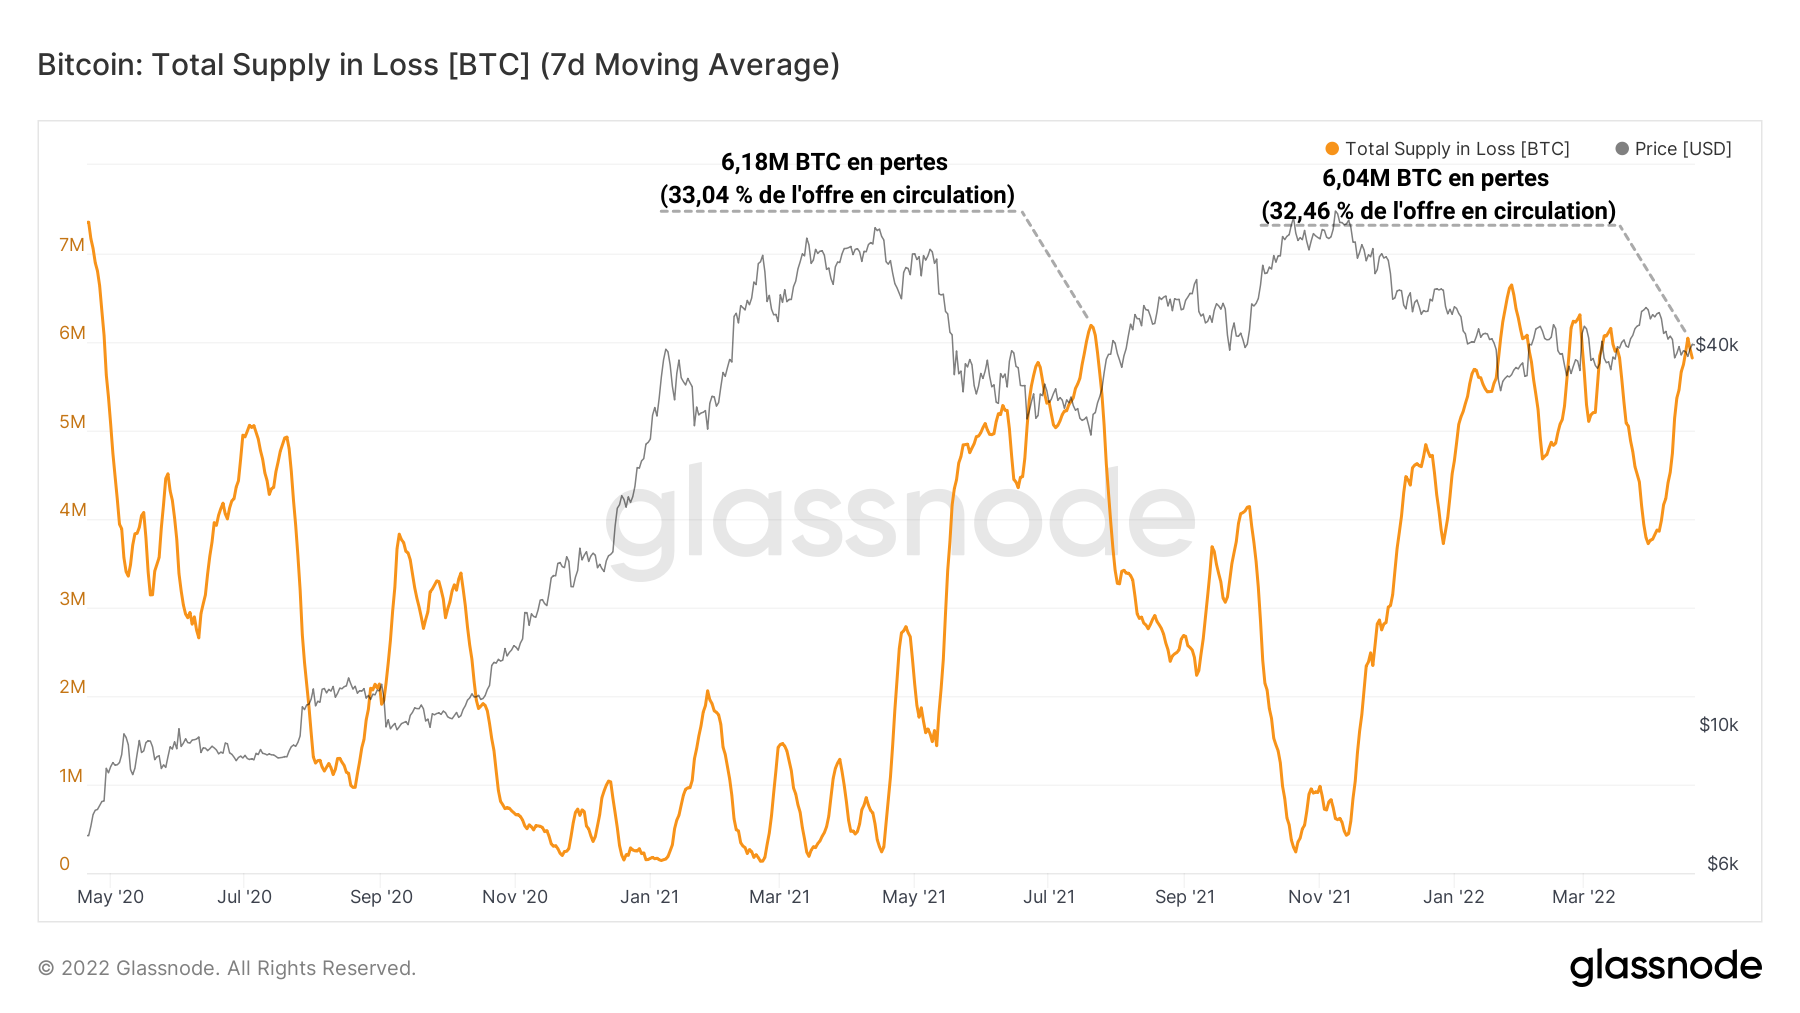
Figure 6: Lost offer
With almost 6 million BTC in a state of latent loss (a third of the BTC in circulation), the market is currently harboring strong potential selling pressure, although its structure is noticeably different.
Indeed, the tracking of realized gains and losses clearly indicates that the current period (yellow) is not dominated by sales , as was the case in May-June 2022 (red).
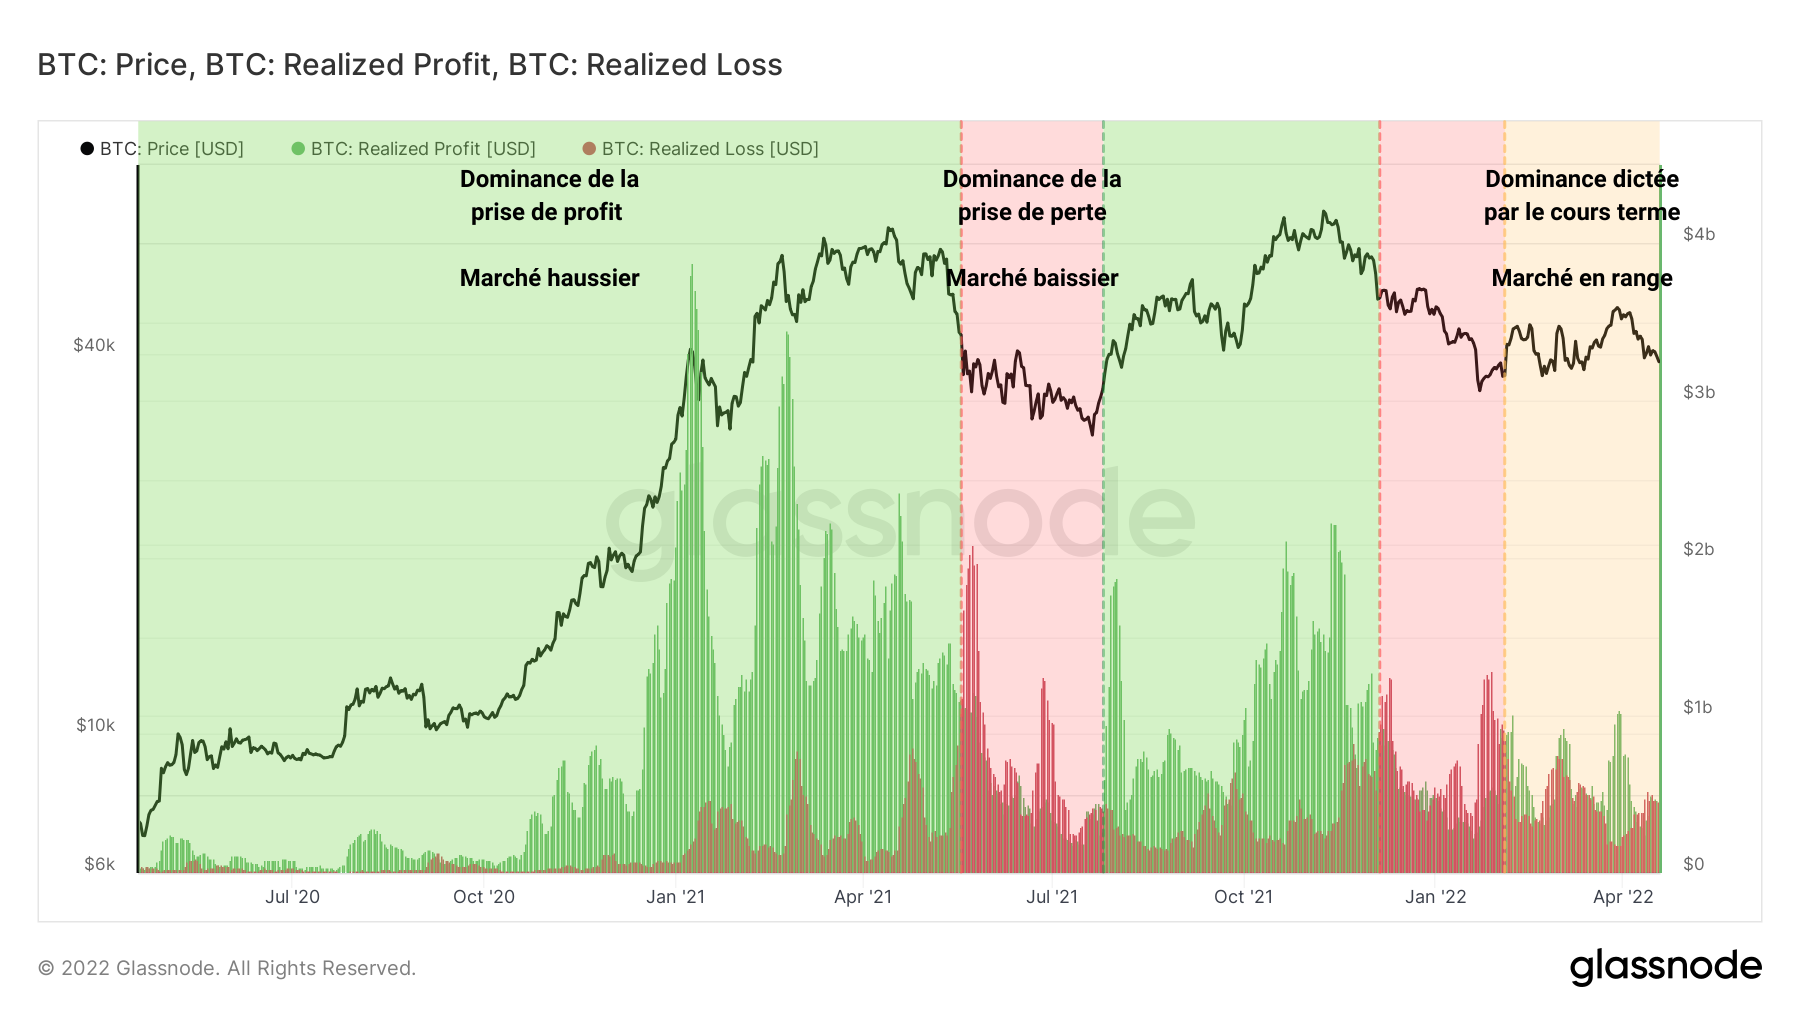
Figure 7: Realized Losses and Profits
Back in the range state, the short-term price action therefore exacerbates profit and loss taking, providing a catalyst for selling and buying pressures.
On the side of short-term investors (STH), participants sensitive to volatility, the state of latent loss still largely dominates , but has not reached the level of pain (>99% of cohort holdings in losses) recorded during final declines, a sign that a fall in the price cannot be ruled out.
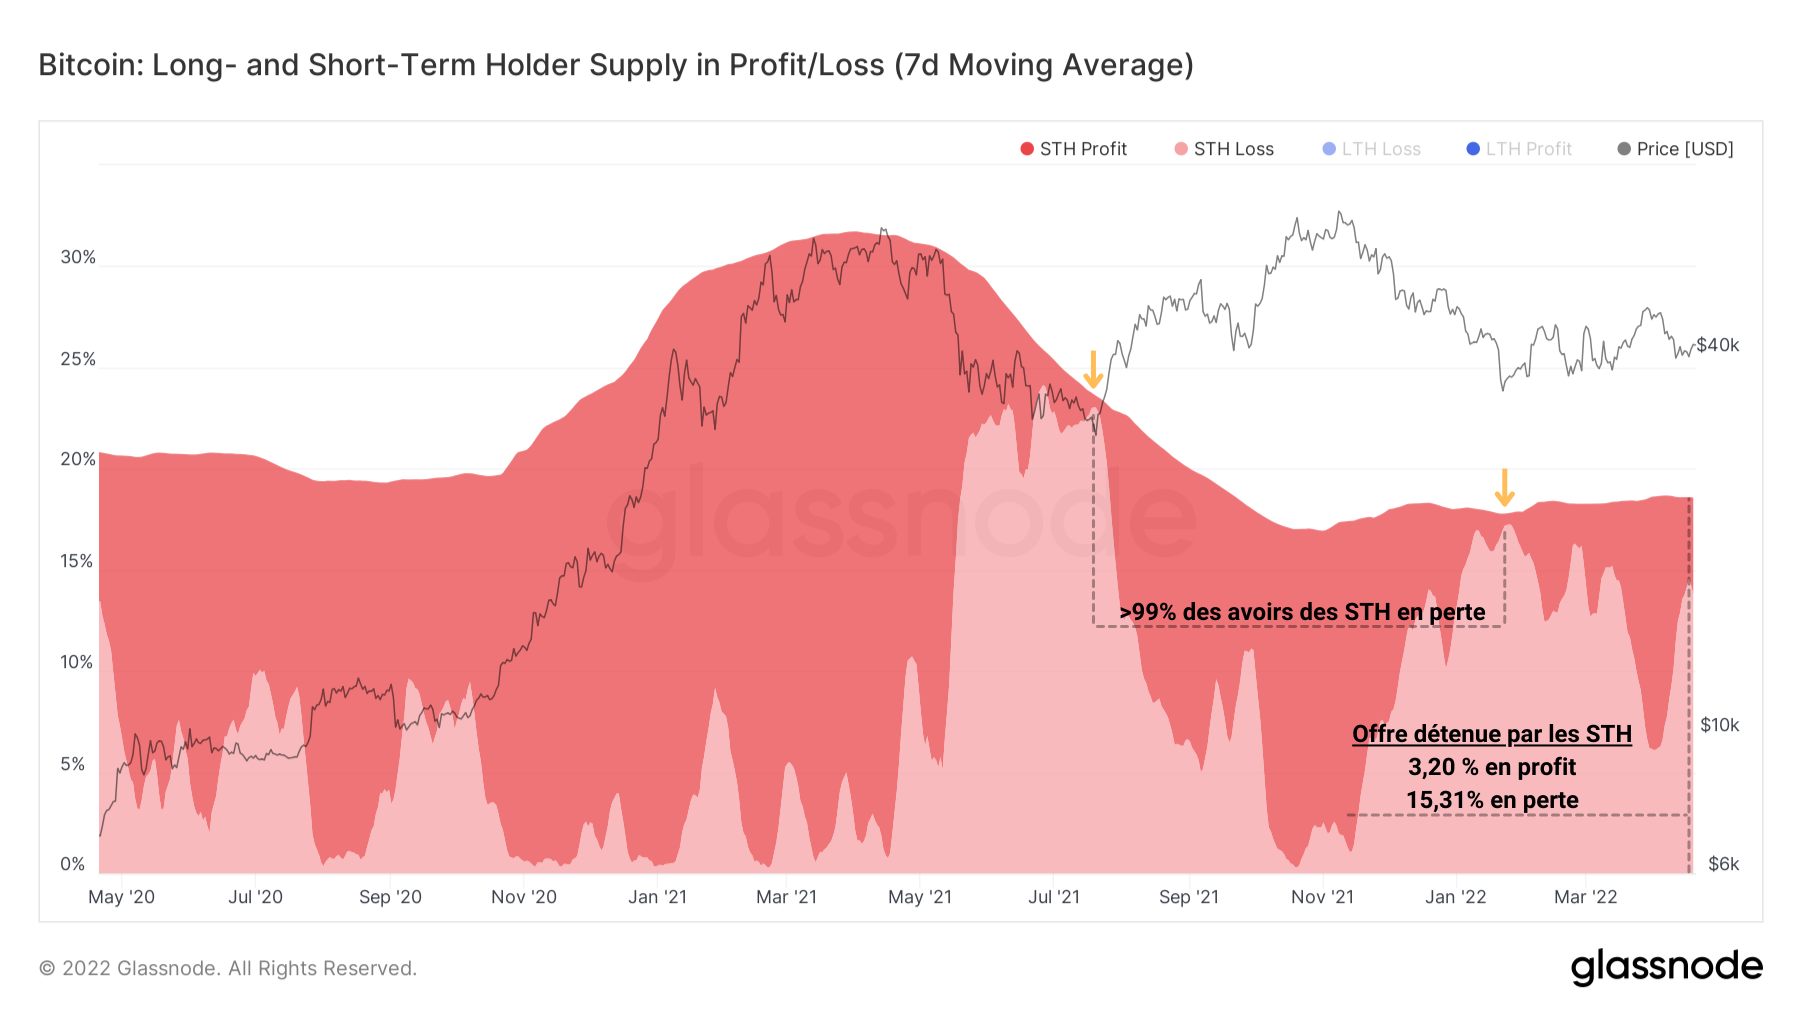
Figure 8: Supply held in Loss or Profit by STHs
Long-term investors (LTH), although mostly profitable, share a similar portion of loss supply (15% to 16%) with STHs. They are, however, less likely to spend their BTC on a decline, preferring the behavior of HODL and accumulation.
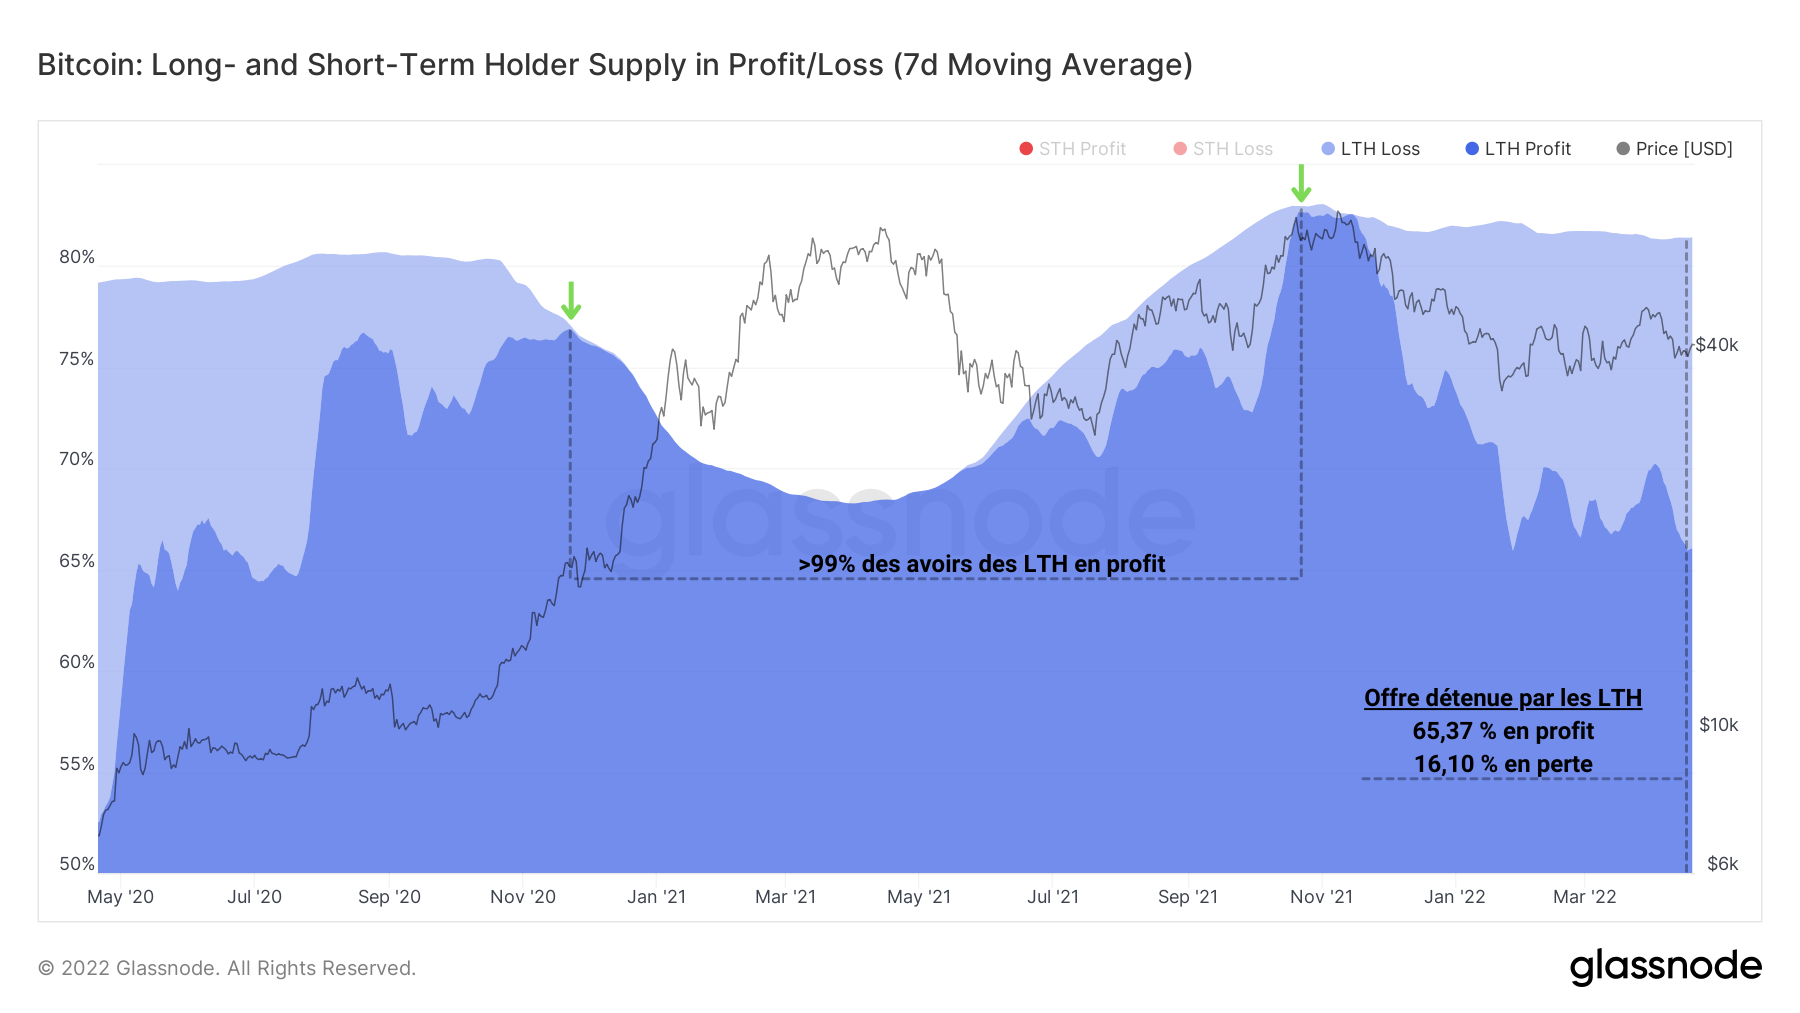
Figure 9: Supply held in Loss or Profit by LTHs
The state of profitability of the market nevertheless remains not very alarming, with less than half of the supply losing and LTH not conducive to selling. Should a price drop occur, the short-term behavior of STHs will set the direction for the next few days .
Miners are waiting for the next bull market
As far as the Bitcoin network is concerned, the weather is good. The computational capacity needed to forge a block reaches 200 Exahash, ensuring high network security by miners now recovered from the Great Migration linked to mining bans in China.
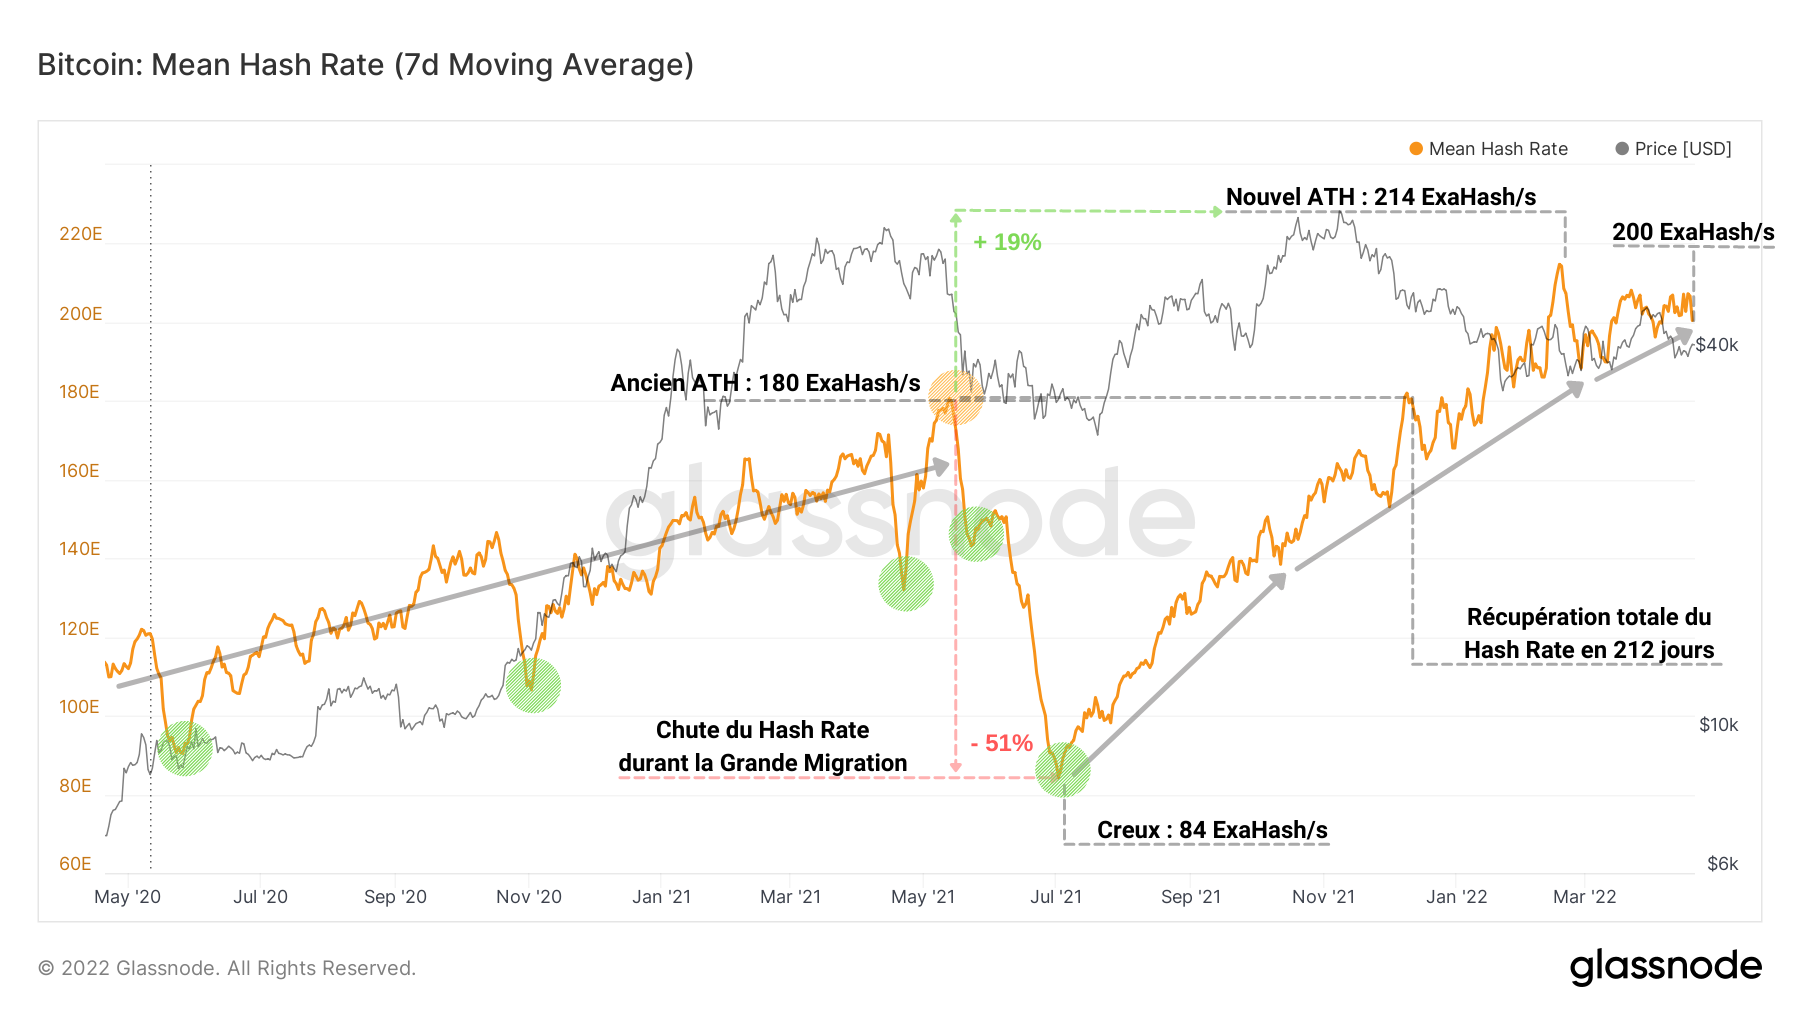
Figure 10: Hash Rate
The Mining Pulse, calculating the difference between the average block interval over 14 days and the target time of 10 minutes, oscillates close to its neutral zone.
The values of this oscillator can be interpreted as the number of seconds to speed up (negative) or slow down (positive) mined blocks relative to the target block time of 600s .
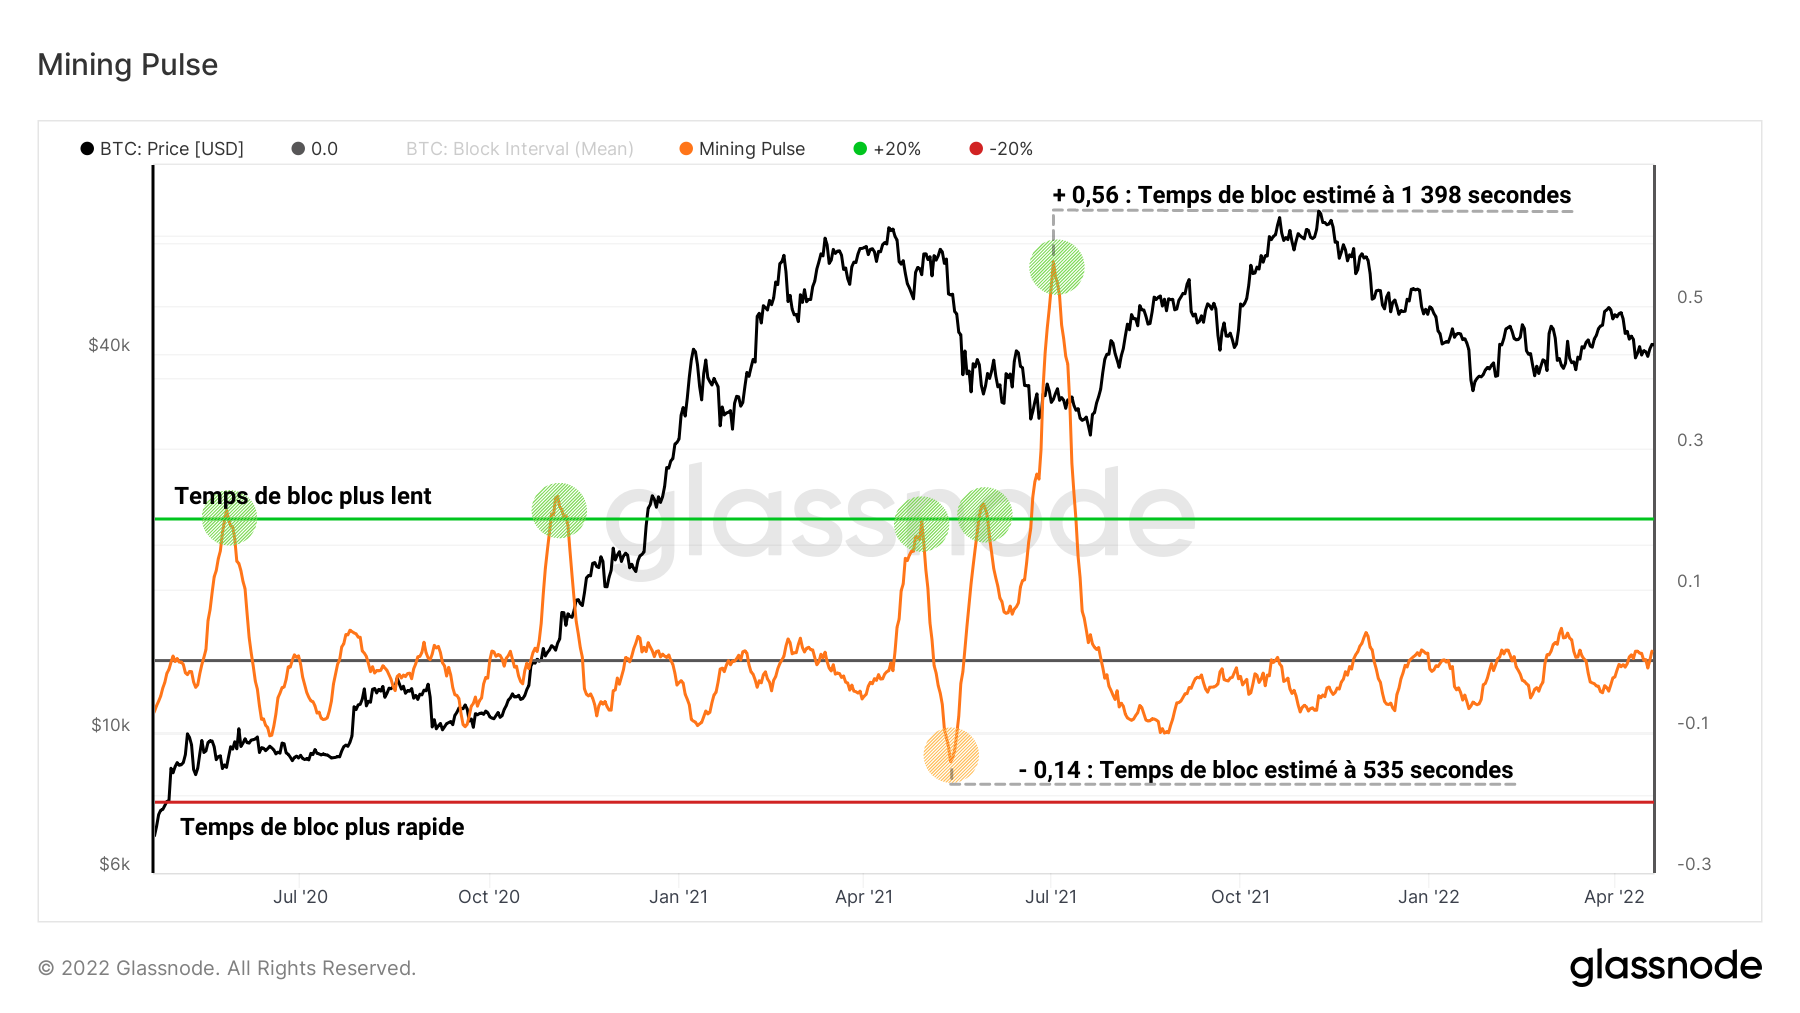
Figure 11: Mining Pulse
We can easily identify periods of slowdown (green), directly related to the fall in hashrate. This usually happens when the hashrate slows down more than downward difficulty adjustments, and indicates miners are going offline, explaining the spike seen in July 2021 .
It thus appears that the Bitcoin network, both in terms of security and rhythm, is performing in a healthy way, despite on-chain activity far from the levels known during bull markets.
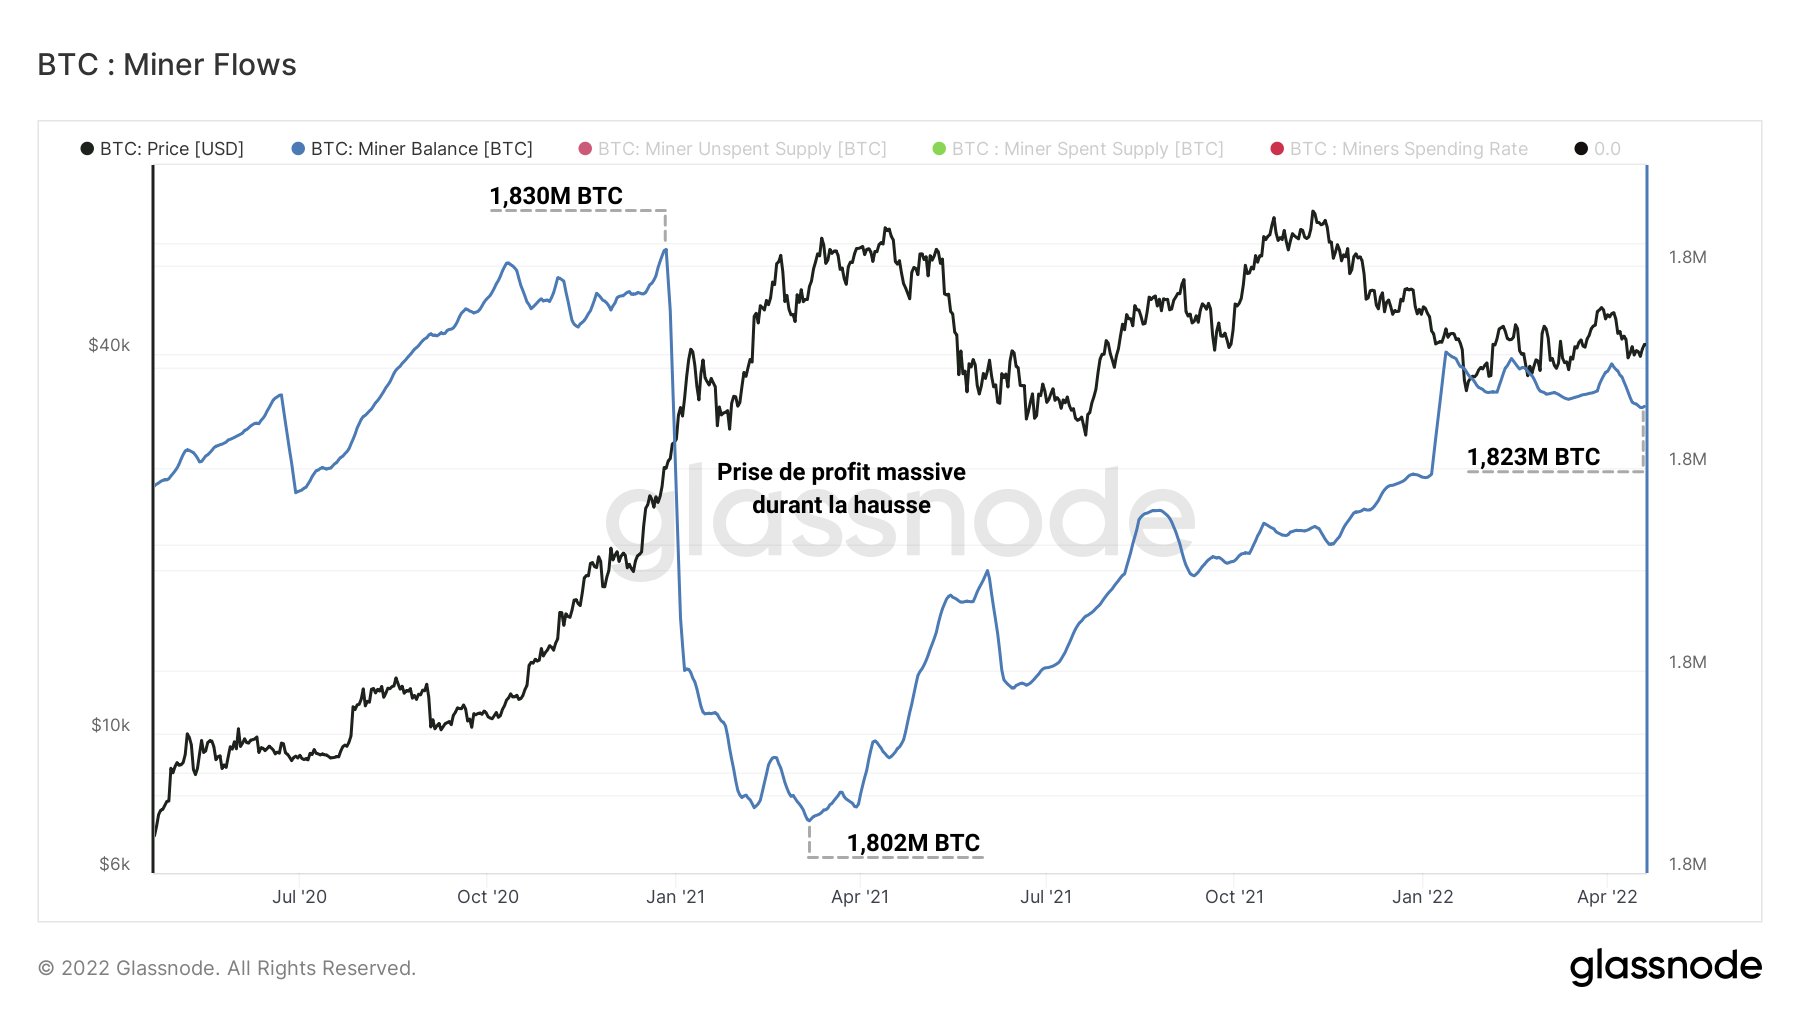
Figure 12: Miners’ Reserves
The cohort of miners has turned out to be very conservative since the November 2021 ATH. After a coordinated profit-taking of almost 30,000 BTC between January and April 2021, these entities, known to be both compulsive sellers for OPEX spending and high conviction HODLers are cautious to say the least.
Indeed, the Change in Net Position of Miners, calculated as the monthly average of the net flows associated with the portfolios of this cohort, shows strong outflows in early 2021 linked to a high destruction of tokens, a sign of profit taking.
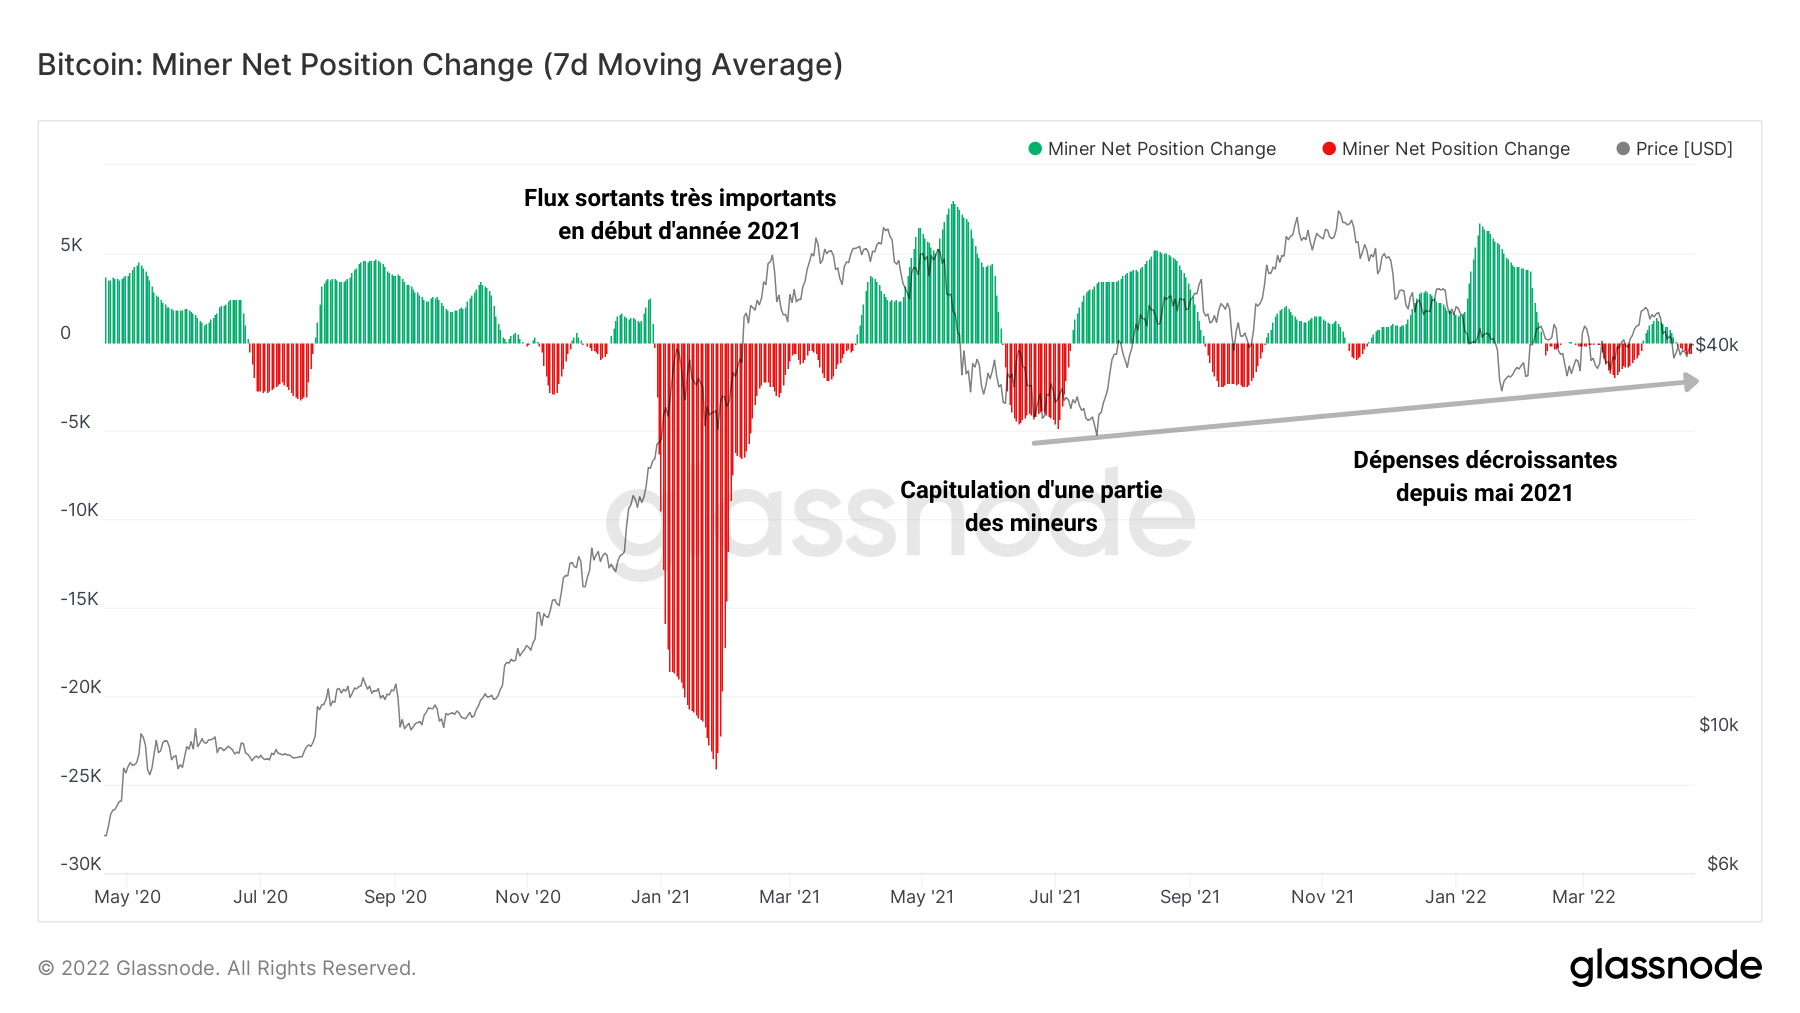
Figure 13: Change in Net Position of Miners
A minor part of these participants then gave in to selling pressure in July 2021, forced to liquidate a portion of their savings in order to cover their travel and installation costs following the Chinese exodus.
This is followed in September 2021 by a constant decrease in the spending of miners, testifying to a savings behavior , pending a new bull market structure within which the cohort will once again realize the profits of the BTCs from block reward.
Summary of this on-chain analysis
Eventually, the market approaches an indecisive structure , with no particular willingness to spend on the part of LTHs or miners.
The age of the BTC spent indicates that the hoard and save behavior still dominates , a sign of a cautious bias on the part of investors.
With a third of supply still in a state of loss, evenly split between STH and LTH, the potential selling pressure does not prove alarming although a capitulation event is not out of reach.
Finally, the security of the Bitcoin network and the pace of block release indicate a healthy fundamental, operated by miners unwilling to sell their tokens at such price levels.
Sources – Figure 1: Coinigy ; Figures 2 to 13: Glassnode