For the past few weeks, we have been talking about a bullish scenario that did not materialize. What is the current situation for Bitcoin (BTC) and Ether (ETH) prices?
Bitcoin (BTC) Technical Analysis
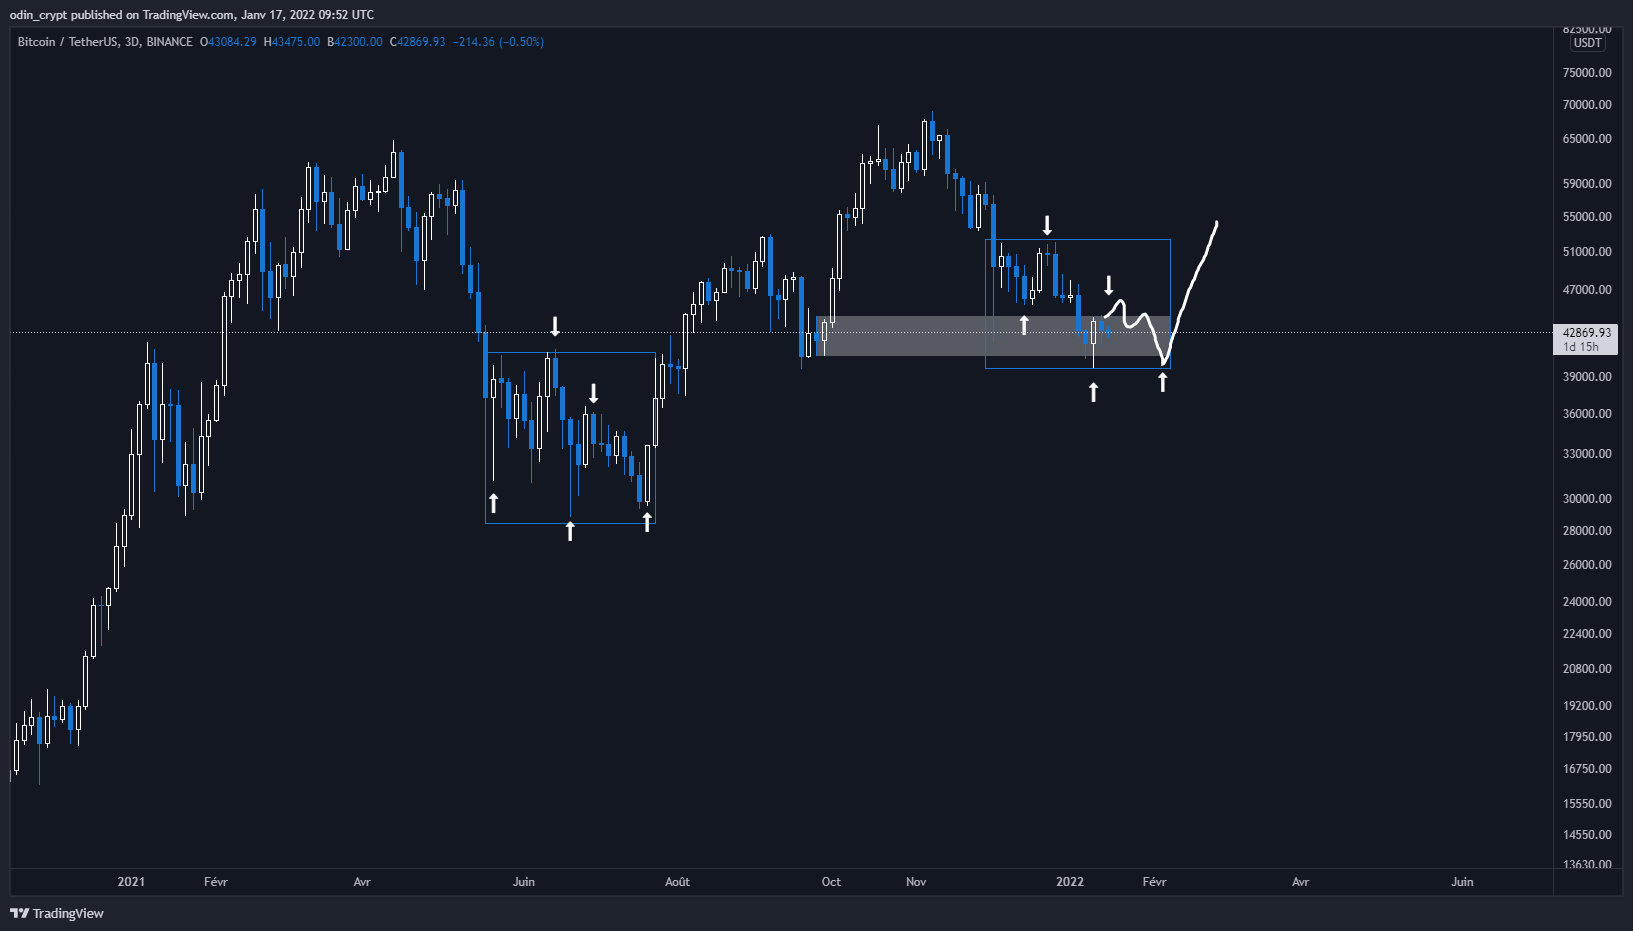
Two weeks ago, I mentioned an upward range breakout for Bitcoin (BTC) after a manipulation phase . Unfortunately, the price broke its range from below and it came to the area of $42,000 – $39,000 .
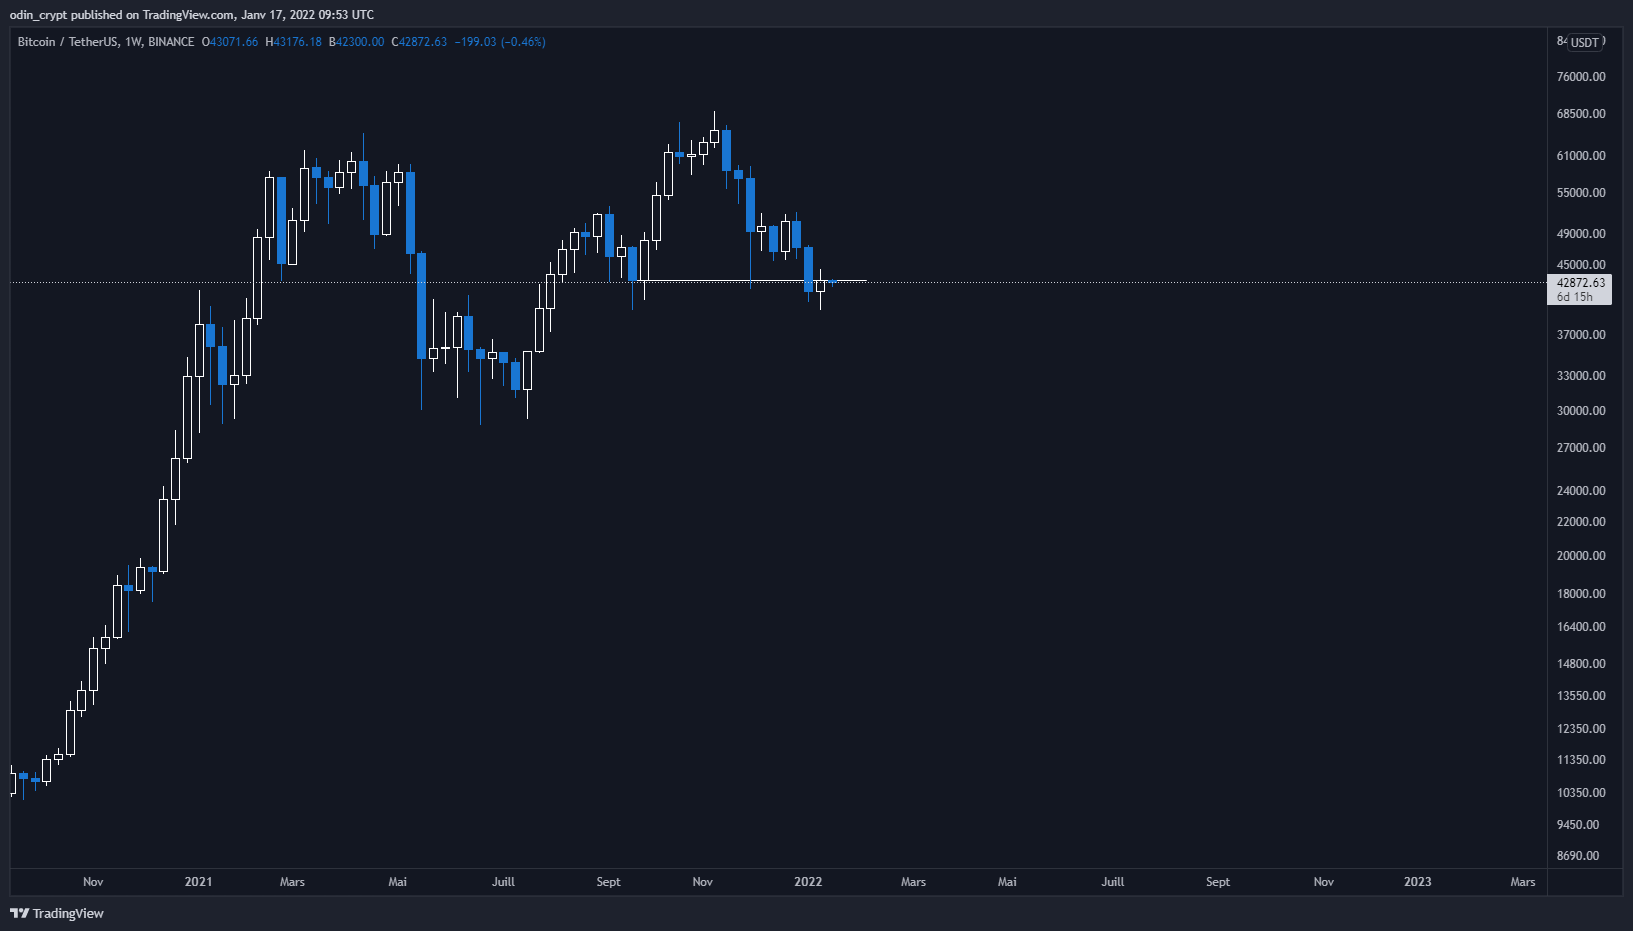
This zone had already served as support for the price when it stalled in December 2021 . Since the price has made certain movements that we will resume to see more clearly. As usual, let’s start with the weekly view . We had identified the $43,100 area as the close of the last trough not to be crossed. We had a close below this point the week before, and yesterday a close almost on this level.
2 interpretations are now possible:
- The last trough has just been crossed on the downside;
- The last low is not clearly crossed.
A validation of the breakout on the downside of this technical point would take us straight to the $30,000 that had played a major role between May and July 2021.
Analysis of Bitcoin (BTC) in 1W
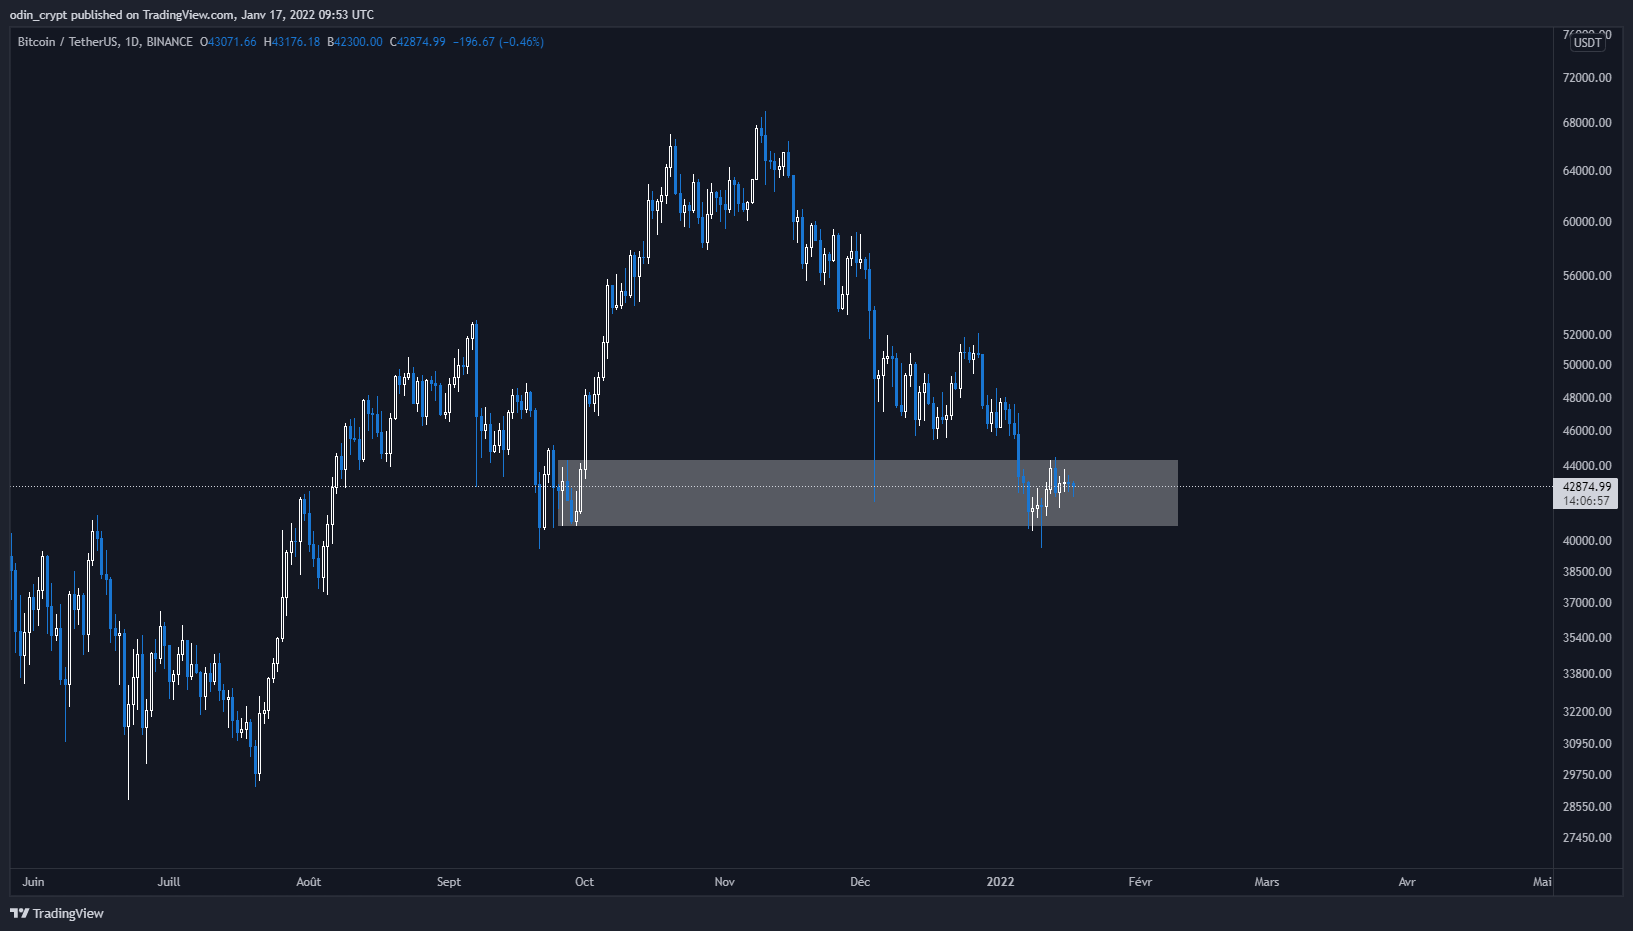
Let’s zoom in on the daily view to refine our analysis. Bitcoin (BTC) remains in its downtrend that it started in November 2021 . It is still in this identified zone of $44,300 – $40,700 with a wick at $39,500 . For the moment, no clear break of the support and we remain in this phase of hesitation .
1D Bitcoin (BTC) Analysis
I would like to introduce you to an additional analysis for Bitcoin. Indeed, I usually complete these analyzes with the price of gold against Bitcoin (PAXG/BTC).
Why ?
Quite simply, because they are diametrically opposed assets . Gold is a safe haven (risk-off) as you probably know, and Bitcoin is a highly speculative asset (risk-on). The basis of my analysis assumes that to hedge against volatility , large wallets will buy gold at the expense of BTC.
We can therefore conclude this very simple mechanism:
- Need for exposure to volatility = investment in BTC;
- Need for stability = investment in gold.
If we take the situation between May and July 2021 , we can clearly see that the price held its resistance which corresponded to the support of $30,000 . On the other hand, the price manipulation is much less important, and the price has technically respected this level. This therefore makes it possible to validate or not a break. In our case, we can see that the resistance on gold against BTC has not been broken, and this confirms that the support for BTC is still valid.
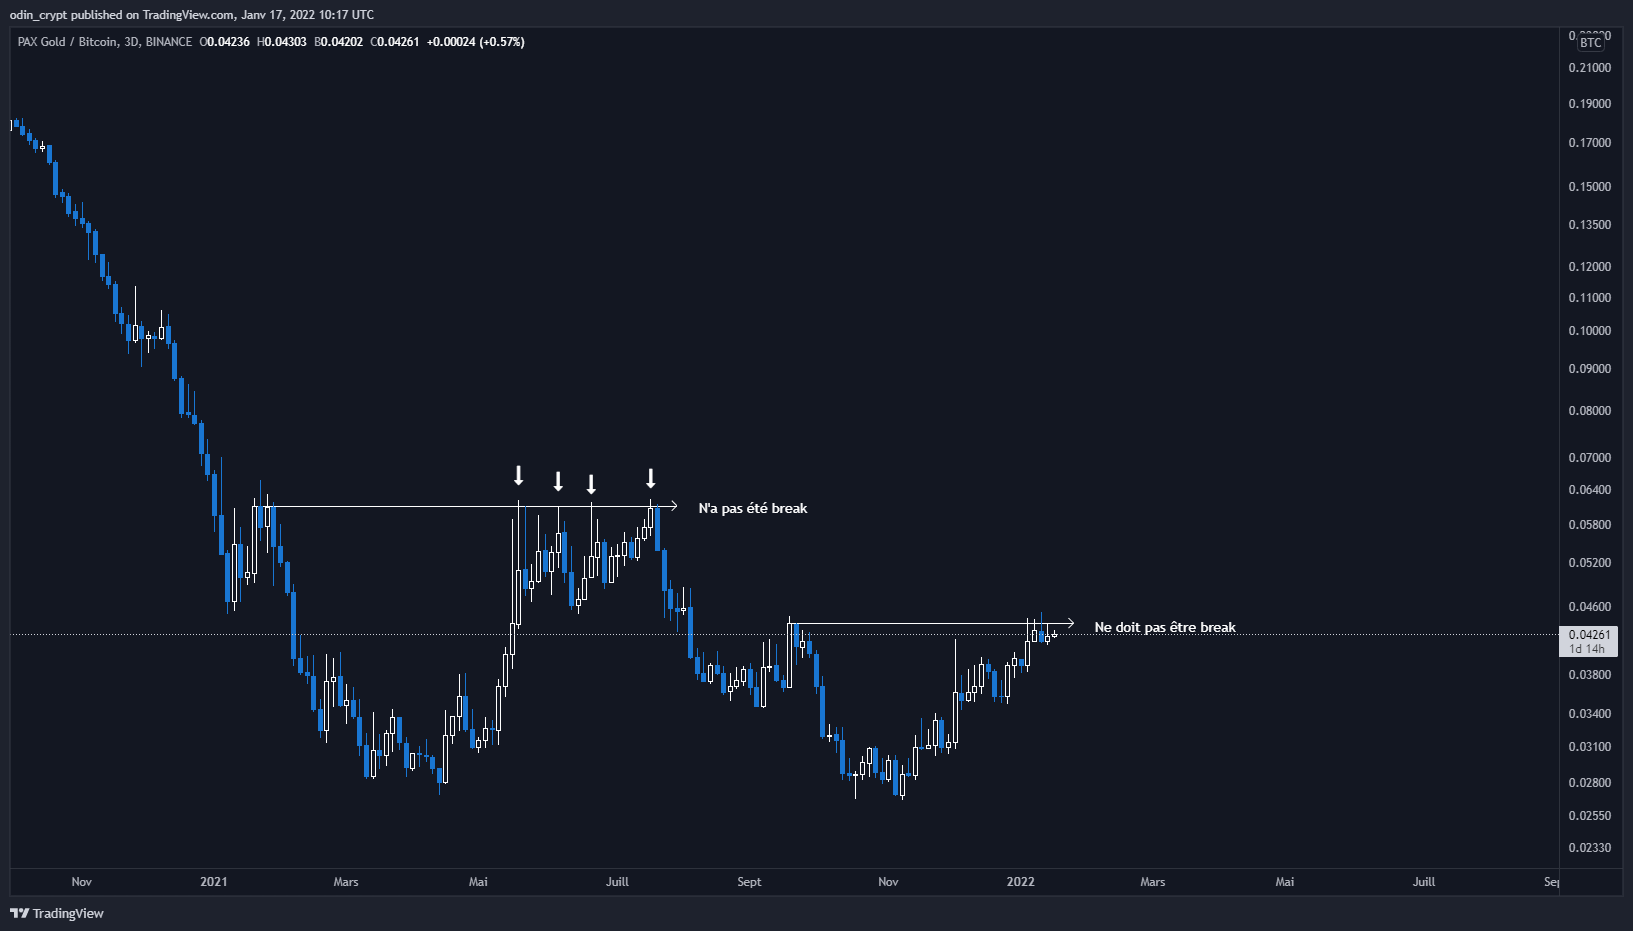
Gold analysis (PAXG/BTC) in 3D
If we return to Bitcoin, and study the possibilities, it appears possible a similar scenario as for May/July.
Trading tools for professionals and amateurs
Bitcoin (BTC) analysis in 3D
Attention, this scenario will be completely invalidated if the support of BTC is broken down , at the same time as the resistance on gold against Bitcoin. What is certain, however, is that the short-term vision (4H) is currently in a bullish configuration and seems to be heading towards the last lost zone, and former low of the range at $45,800 – $46,800.
This area will give us a good indicator of the continuation , because the latter is conducive to taking shorts (betting against the market). This would still fit into the theory mentioned above with a final bearish wave that would kick out the last players for good.
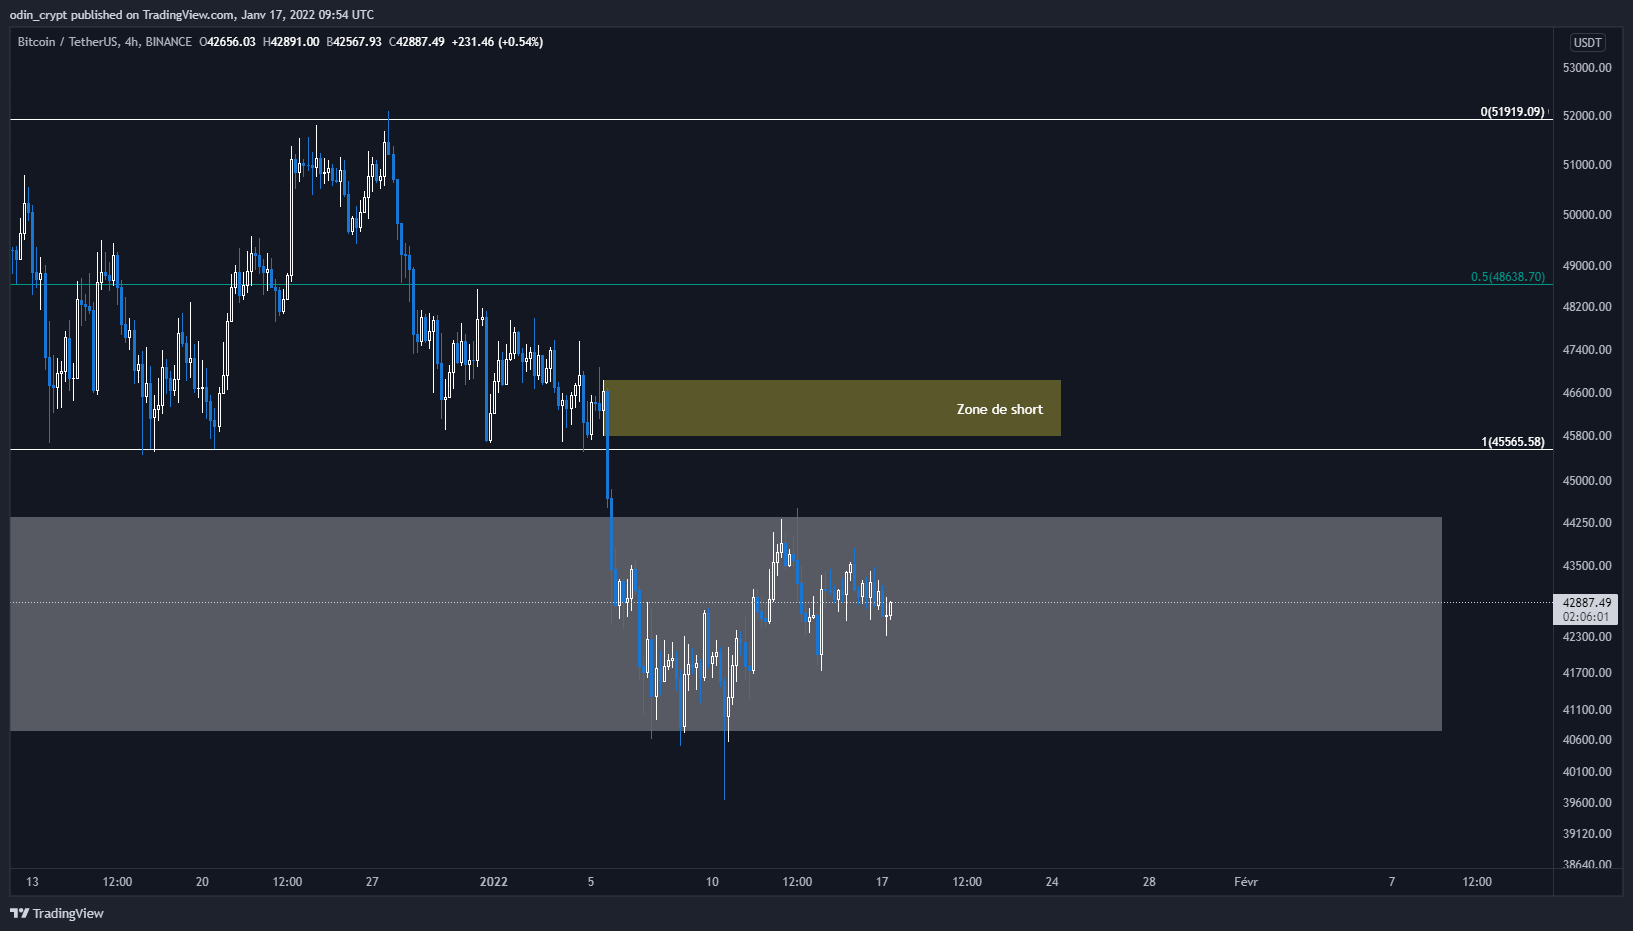
Analysis of Bitcoin (BTC) in 4H
Content with high added value and quick to consume
Conclusion
Bitcoin (BTC) lost its important level of $46,000 – $45,000 and came to rest on its support of $39,000 – $40,000 . For the moment the price manages to hold this zone, and could reinitiate a short-term bullish movement . Nevertheless, it will be necessary to regain many levels to hope to see the macro trend resume the upward path. In the event of a break from below , the $30,000 should serve as an area of short-term interest.
On the Ether (ETH) side , the price has validated its retracement in the $3,200 area , managing to maintain it. An encouraging sign for a macro bullish recovery, it will nevertheless be necessary to temporize to digest the violent movements of recent weeks.
In any case, we will have to remain patient and seize the opportunities on the other assets present in the ecosystem.