
The top (also called top) is a high point reached by the price of an asset over a given period of time. In technical analysis, it is imperative to know how to detect these peaks, because they not only make it possible to define relevant price objectives, but also to anticipate possible trend reversals. We’ll show you how to spot them.
What is a top?
In trading, a top reflects a high point reached by the price of an asset . These tops can be identified in all types of chart patterns, regardless of the trend.

Indeed, the price can reach high points in the short term without this calling into question the long-term downward trend, hence the importance of the time scale used to carry out its graphical analyses.
We must not hide either the fact that the price of an asset naturally oscillates between low points and high points, which are all natural breaths of the market.
For cryptocurrency or stock market trading, a top can be thought of as resistance, a fundamental concept in technical analysis. The latter plays a major role in predicting a trend reversal , and placing stop orders (take profit and stop loss) accordingly.
Why is it important to spot tops?
The tops are key thresholds that can be considered as take profit thresholds for traders who are long (those who bet on the rise of the asset). They can also be seen as potential support for short traders (those who bet on the decline of the asset).
If the price touches a peak several times and retraces each time it touches it, then the top will be identified by the market as a resistance : this means that the chances are strong of seeing the price fall as soon as the price touches this high point. This is why traders try to spot the tops: the buyers will take their profits when the price hits this high point. Sellers will choose this threshold to place their stop loss .

Top example – Source: TradingView
Conversely, what happens if the resistance is exceeded ? The breakout of a resistance sends a strong signal to the market: the balance of power between buyer and seller clearly tilts in favor of the buyers, the sellers capitulate and the price can then accelerate upwards. From a technical analysis perspective, breaking through resistance turns resistance into support . A top can therefore be both a threshold for taking profits or for cutting losses, it all depends on your trading strategy .
Chart patterns that use tops
Many chart patterns are identifiable by a succession of tops. Among these figures, we can cite two famous reversal figures: the double and triple top .
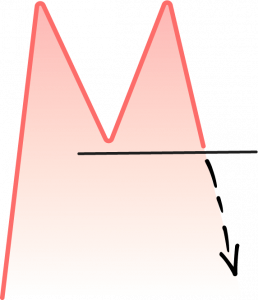
A double top
As a reminder, a double top appears at the end of an uptrend. We easily recognize this figure which takes the form of an M and predicts a bearish reversal.
The triple top is a chart pattern represented by three successive tops . Like the double top, this pattern reflects the exhaustion of the buying current and the inability of the price of an asset to exceed its highs, which results in a bearish reversal.
Conclusion
Knowing how to spot the tops is fundamental in technical analysis, because it is from these thresholds that trend reversals can be triggered. The detection of tops also makes it possible to gauge the balance of power between buyers and sellers and to define relevant objectives (stop loss or take profit).