Bitcoin (BTC) ends January on a note of optimism. Although it is too early to seriously declare that a trend reversal is at work, many indicators suggest that the market is preparing for it by adopting a structure opposite to that of the end of 2021. On-chain analysis of the situation.
Bitcoin regains strength
Bitcoin (BTC) price closes January with a week of gradual upside and prints a monthly candle above $35,000.
On its way to test the resistance at $40,000 , Bitcoin price is still below the EMA 21 , the first technical indicator to break before a bull market rally can be considered.
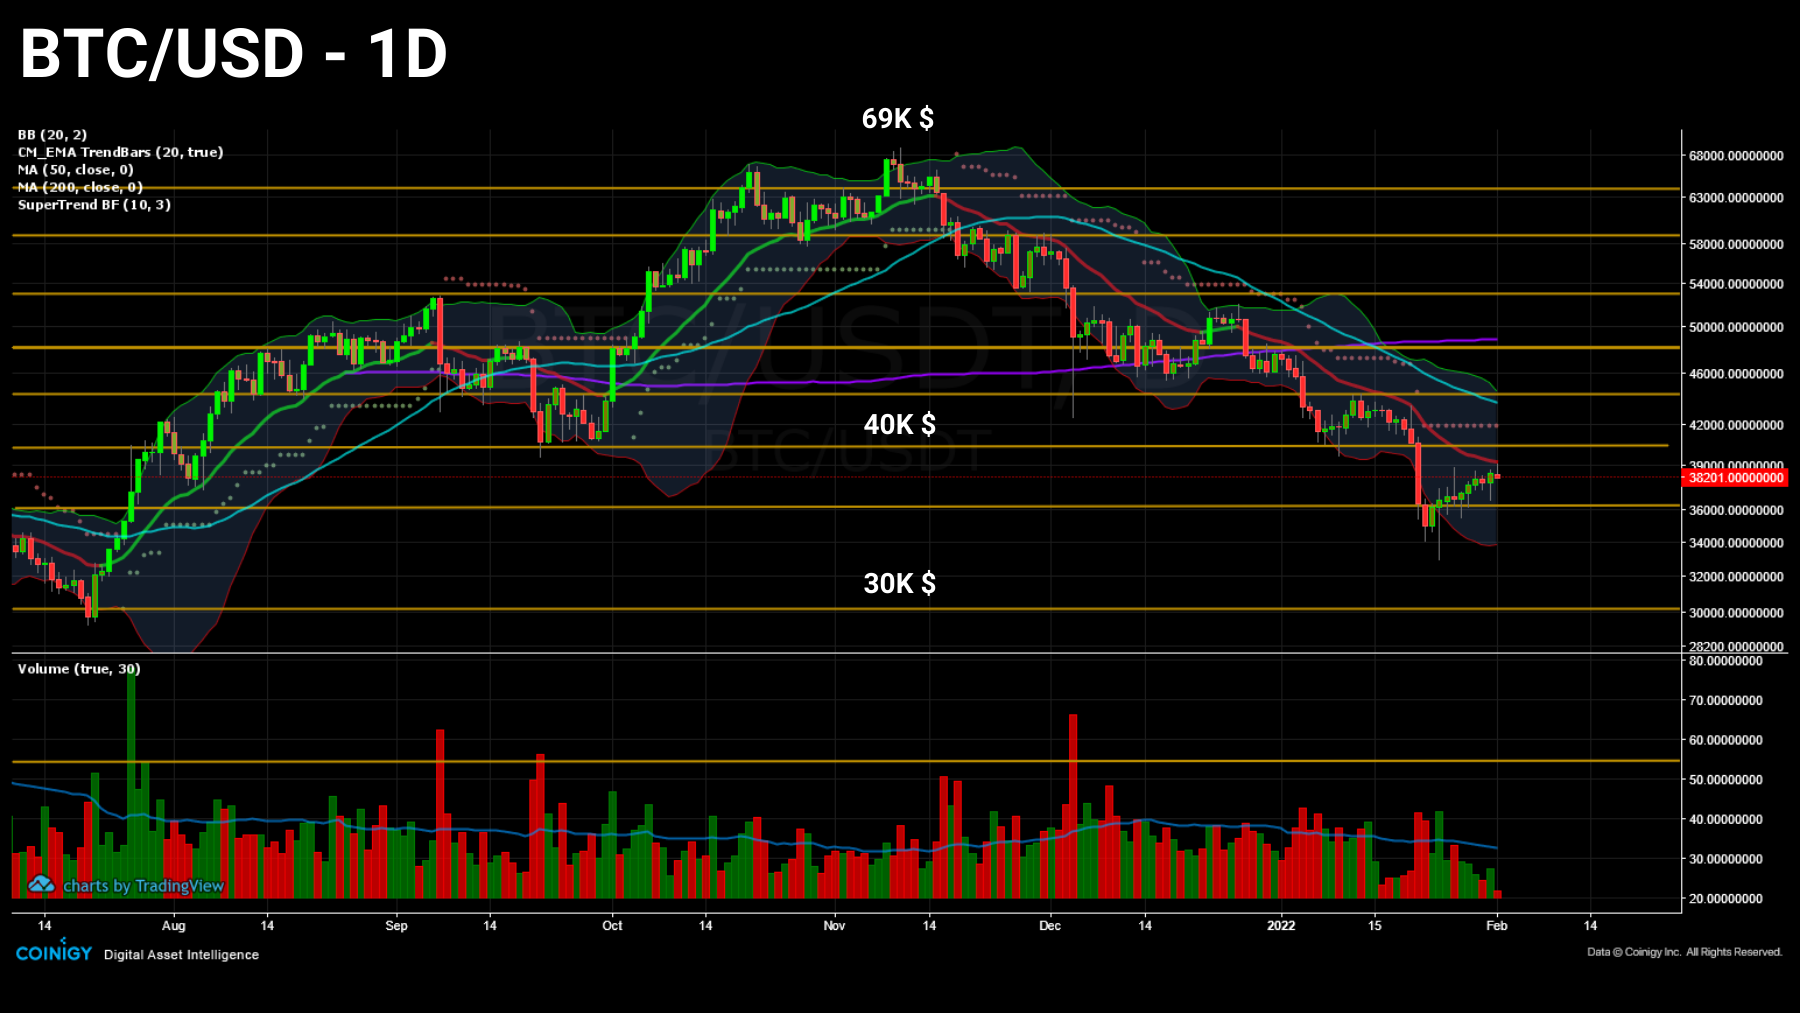
Bitcoin price daily chart
Nevertheless, harbingers of a trend reversal are gradually forming and bode well for a decisive month of February for the long-term direction of the cryptocurrency market.
This week again, we will observe a wide spectrum of indicators with the aim of identifying the premises of a future movement based on:
- the sustained buying behavior of various cohorts;
- the growth of the transfer volume on the chain;
- the emergence of bearish speculative positions ;
- the bullish divergence of the realized gradient.
A very attractive shopping area
To set the scene, let’s start by noting that, from a monthly perspective, BTC is in a significant buy zone. At just -50% of its ATH, the asset is trading at enough value to generate visible interest.
Since the peak of the parabolic phase of 2017, a monthly return below -30% is a rare event , occurring only six times in the space of four years.
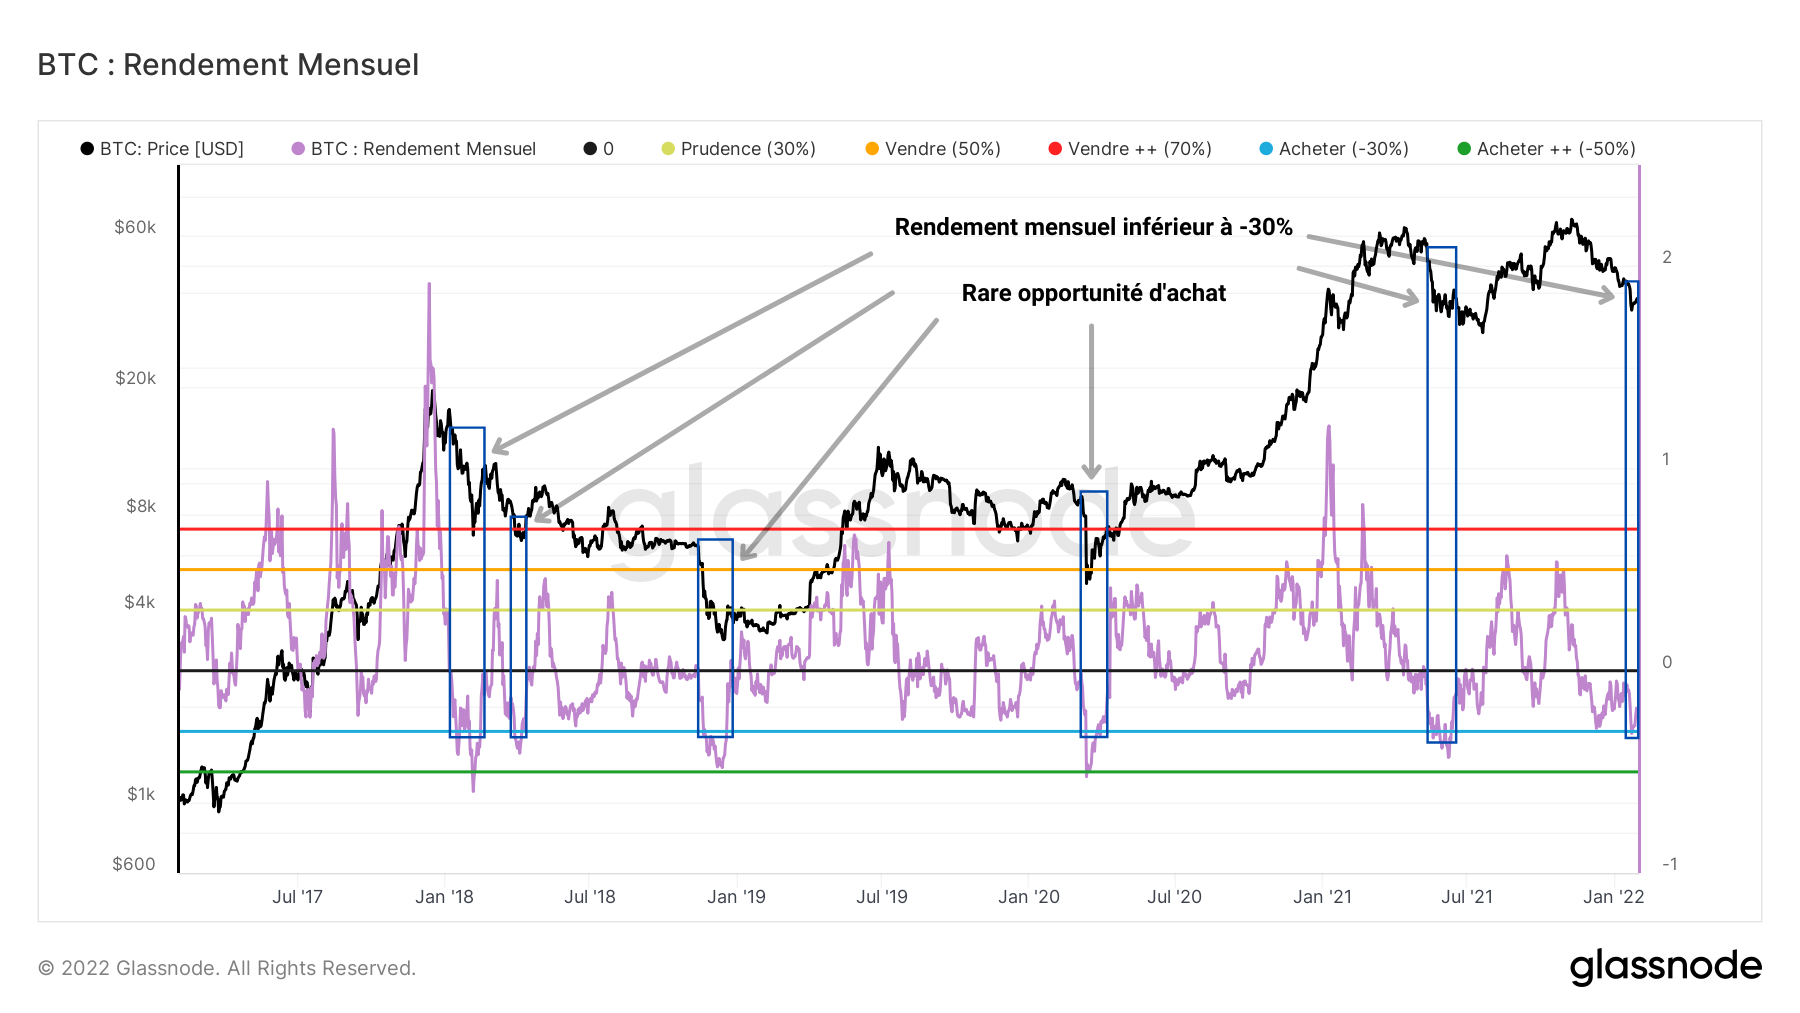
Bitcoin Monthly Return Chart
It is in this regard that many participants have taken advantage of the ongoing correction for 77 days now to accumulate ever more bitcoins at low prices.
Judging by the continual rise in the number of BTC addresses with a non-zero balance since May 2021, this drop has not stopped investors from stacking satoshis, especially via dollar cost averaging strategies .
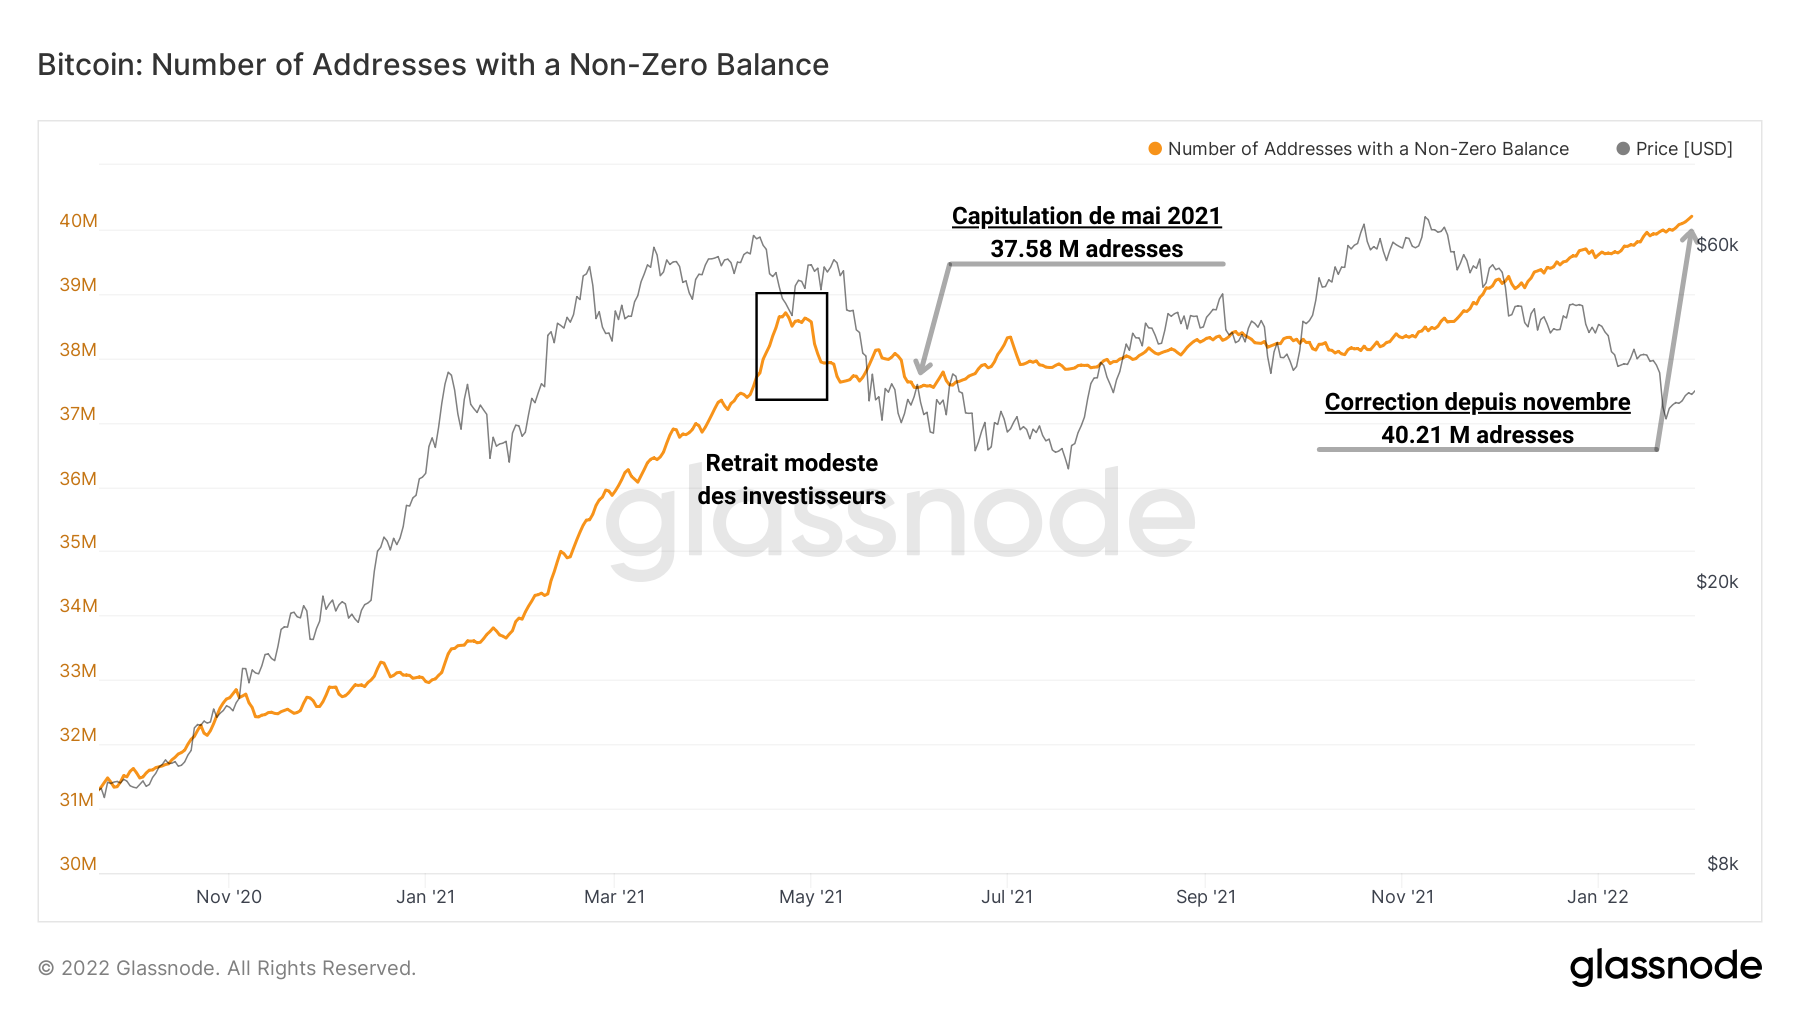
Graph of bitcoin’s non-zero balance address account
Indeed, Ecoinometrics data reports that significant buying – and even saving – behavior is happening behind the scenes.
Not only are addresses controlling less than 1 BTC on the rise, but the “ whales ”, those addresses controlling between 1,000 BTC and 10,000 BTC, are also in the game.
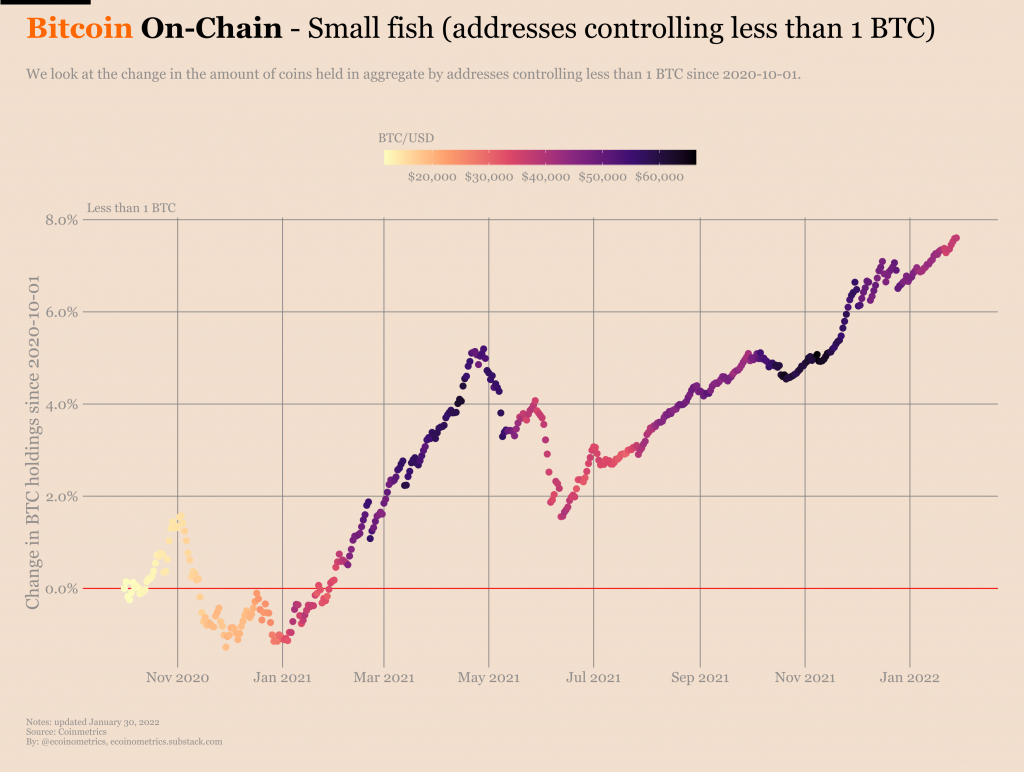
Graph of % change in holdings of addresses holding less than 1 bitcoin
While fish have been accumulating since July 2021, cetaceans started a new wave of buying at the start of 2022. The average base cost of their recent positions is close to $37,000 .
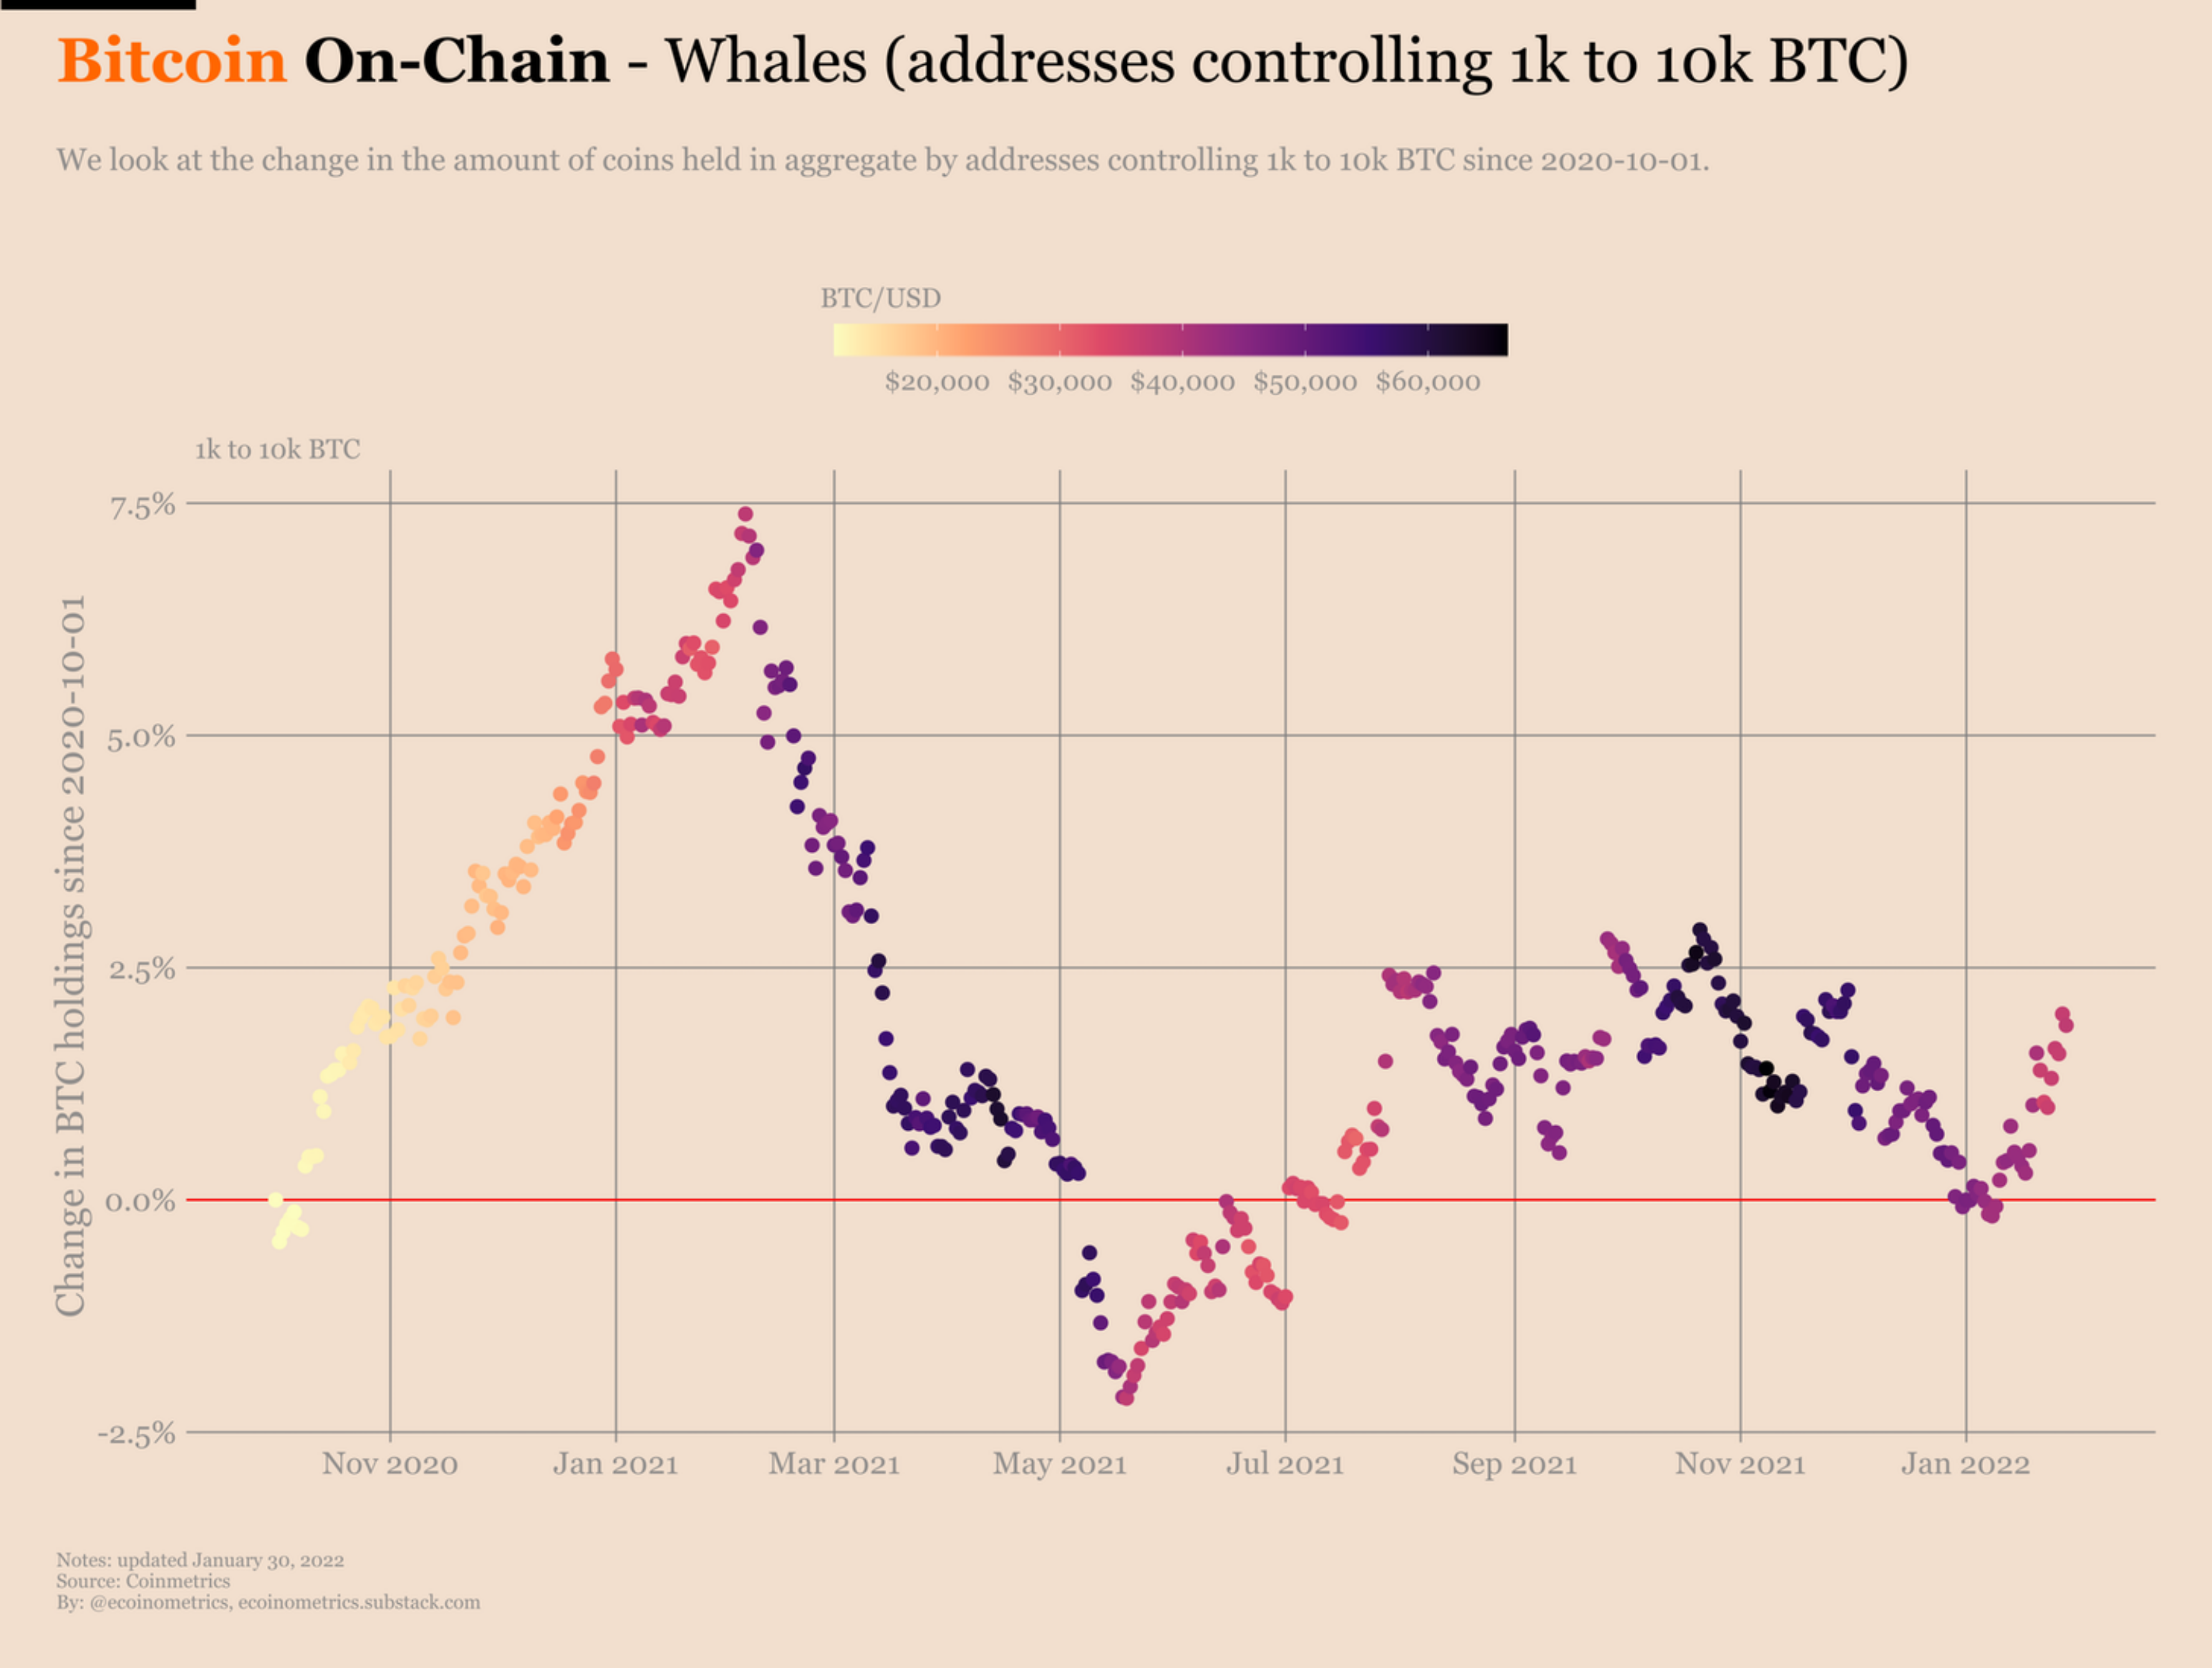
Graph of % change in holdings of addresses holding between 1,000 and 10,000 bitcoins
Impossible to say if we have reached the bottom of the correction, although the behavior of the participants is the opposite of what it was two months ago.
Current price levels are attracting many entities as February begins with strong spot demand .
An increasingly popular channel
Now let’s go back in time and see how BTC price has reacted to transfer volume over the past five years.
Typical of a parabola top like the market has experienced since 2011, the 2017 top marks a historic transfer peak then disappears precipitously, a sign of a rapid disengagement of market participants.
They then bequeath the channel to its regular users, generating an average volume of around $2 billion moved daily.
A new transfer volume ATH does not take place until four years later, in January 2021, as the market welcomes new entrants .
Indeed, nations, companies, funds and emerging derivatives markets are getting involved alongside more and more individuals and soliciting the chain in an unprecedented proportion .
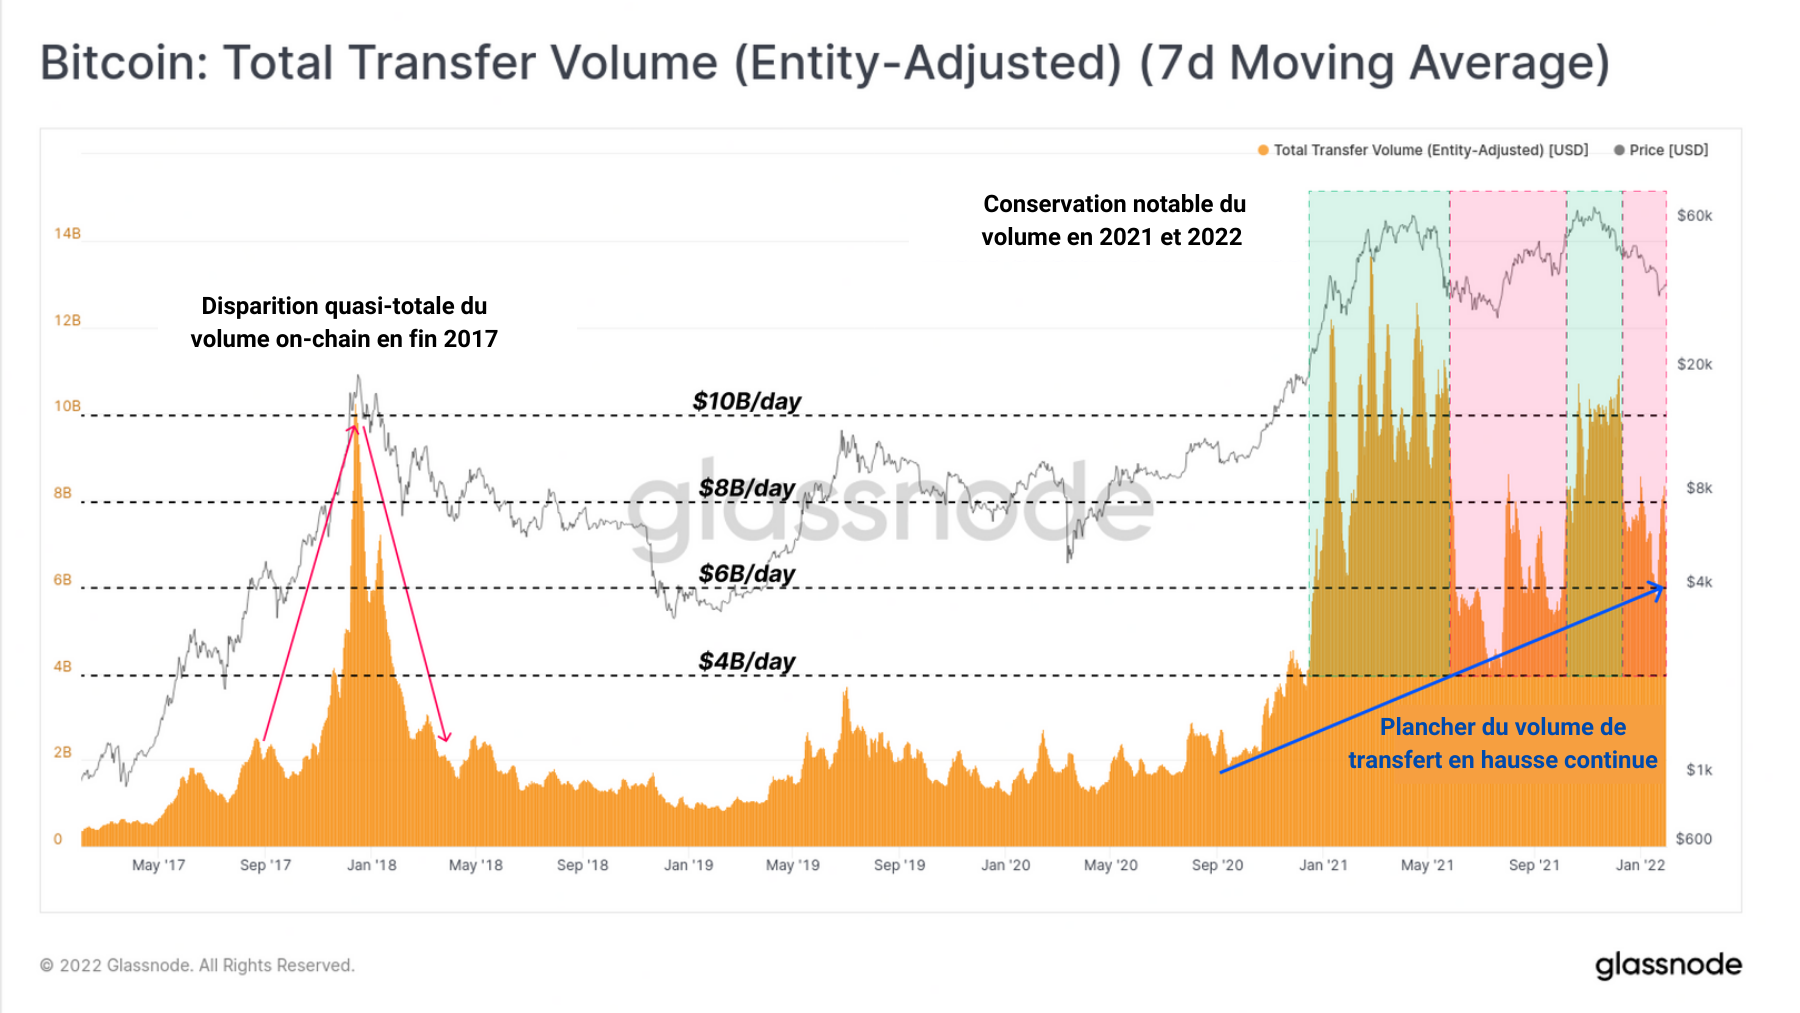
Bitcoin Transfer Volume Chart
It is in this context that the floor of the volume gradually increases while the use of the channel varies according to the trend while maintaining its consistency.
The “low network utilization” annotation would consider low NVTS as a sign of a poor transfer chain, a clumsiness that should be rectified immediately.
Remember: the NVT signal is an indicator obtained by dividing the bitcoin network net worth ( mCap ) by the 90-day average transfer volume . This variant resulting from the NVT ratio therefore respects the same rules.
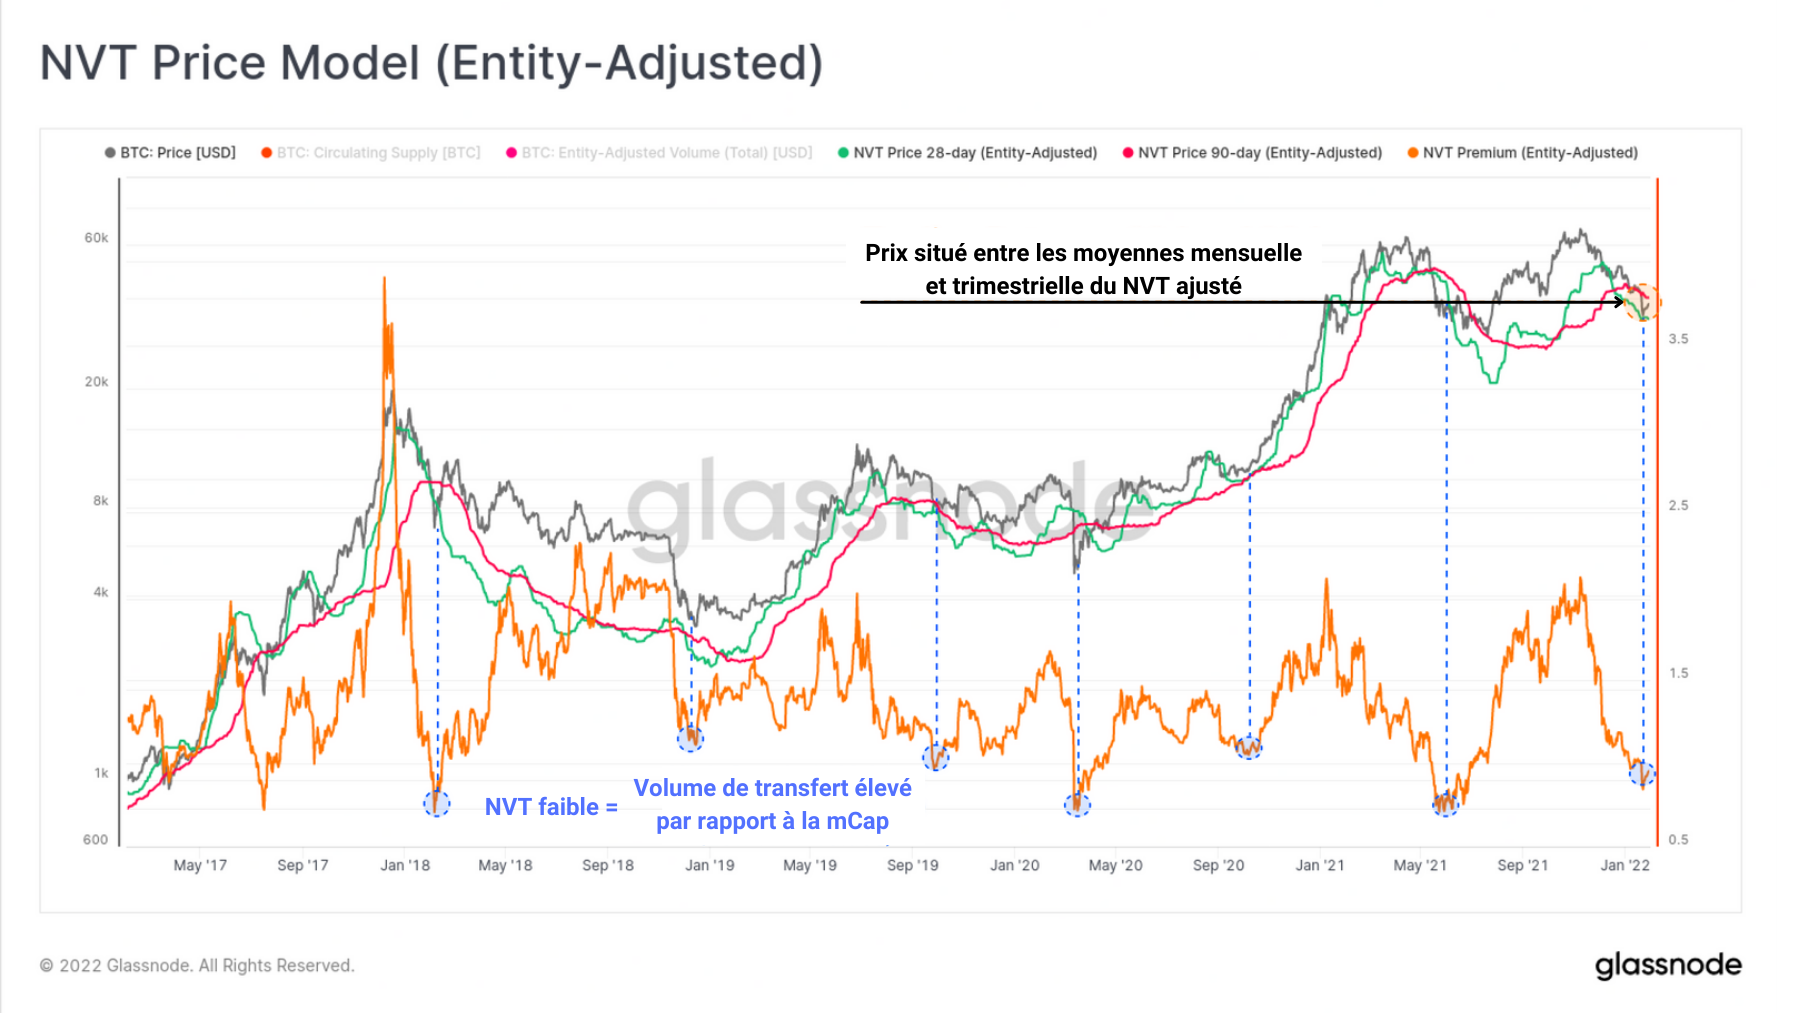
Bitcoin NVT Signal Chart
If the mCap falls relative to the transfer volume, the deepest troughs of the oscillator are reached when the transfer volume increases over the same period.
This indicates significant network usage at a time when the market is correcting, a continuous engagement of participants that does not occur with every correction.
Such a low NVTS has only existed four times since the end of 2021. Rare are the days when the bitcoin network has been so undervalued for use in the past.
Bearish bias on derivatives
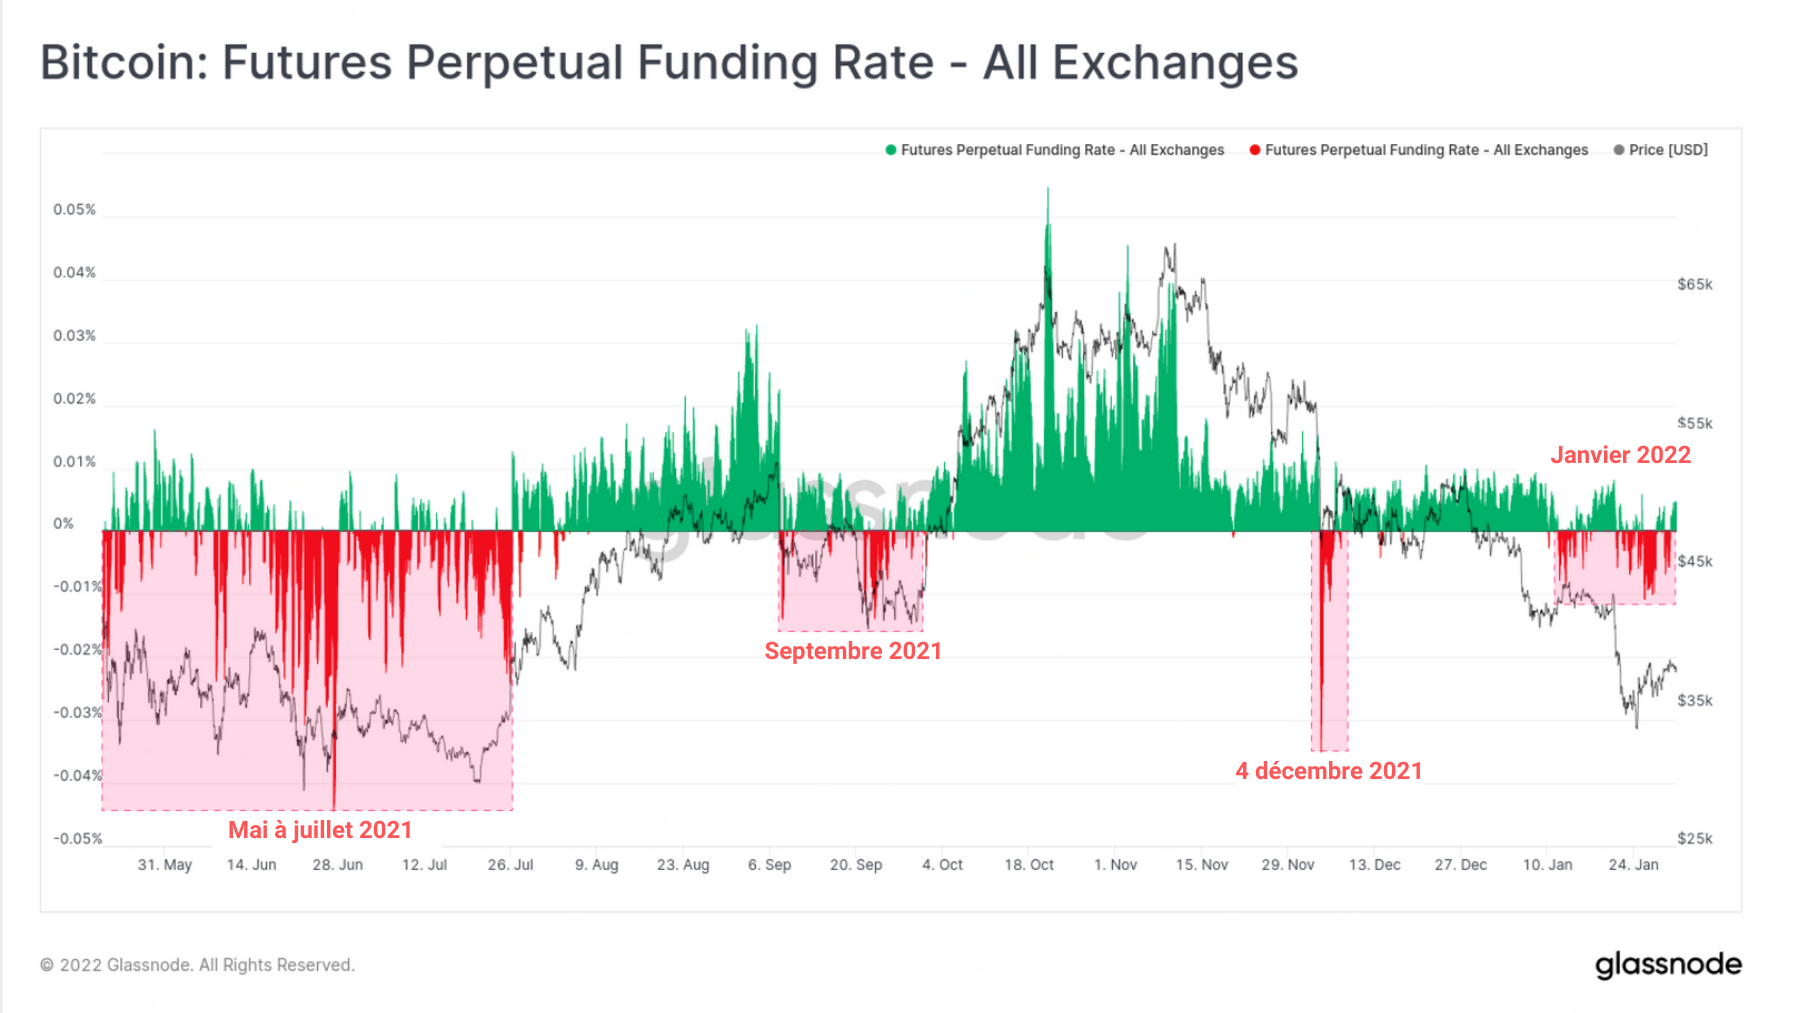
Despite substantial spot demand , short positions appear on the derivatives markets while open interest remains very high.
As demonstrated below, the funding rate for perpetual contracts turned negative repeatedly as early as January 11, although its magnitudes remained small.
Some speculators are obviously opening bearish positions and others might be following in an effort to sell BTC in the short area hinted at in CryptOdin’s technical analysis to stave off a rebound.
Funding rate chart for bitcoin perpetual contracts
A similar behavior is emerging in the options markets, with the Put/Call ratio reaching 59%, the highest in several months.
This indicates that speculators have shifted their preference from calls to buying downside insurance, even as the market trades at notably low price levels.
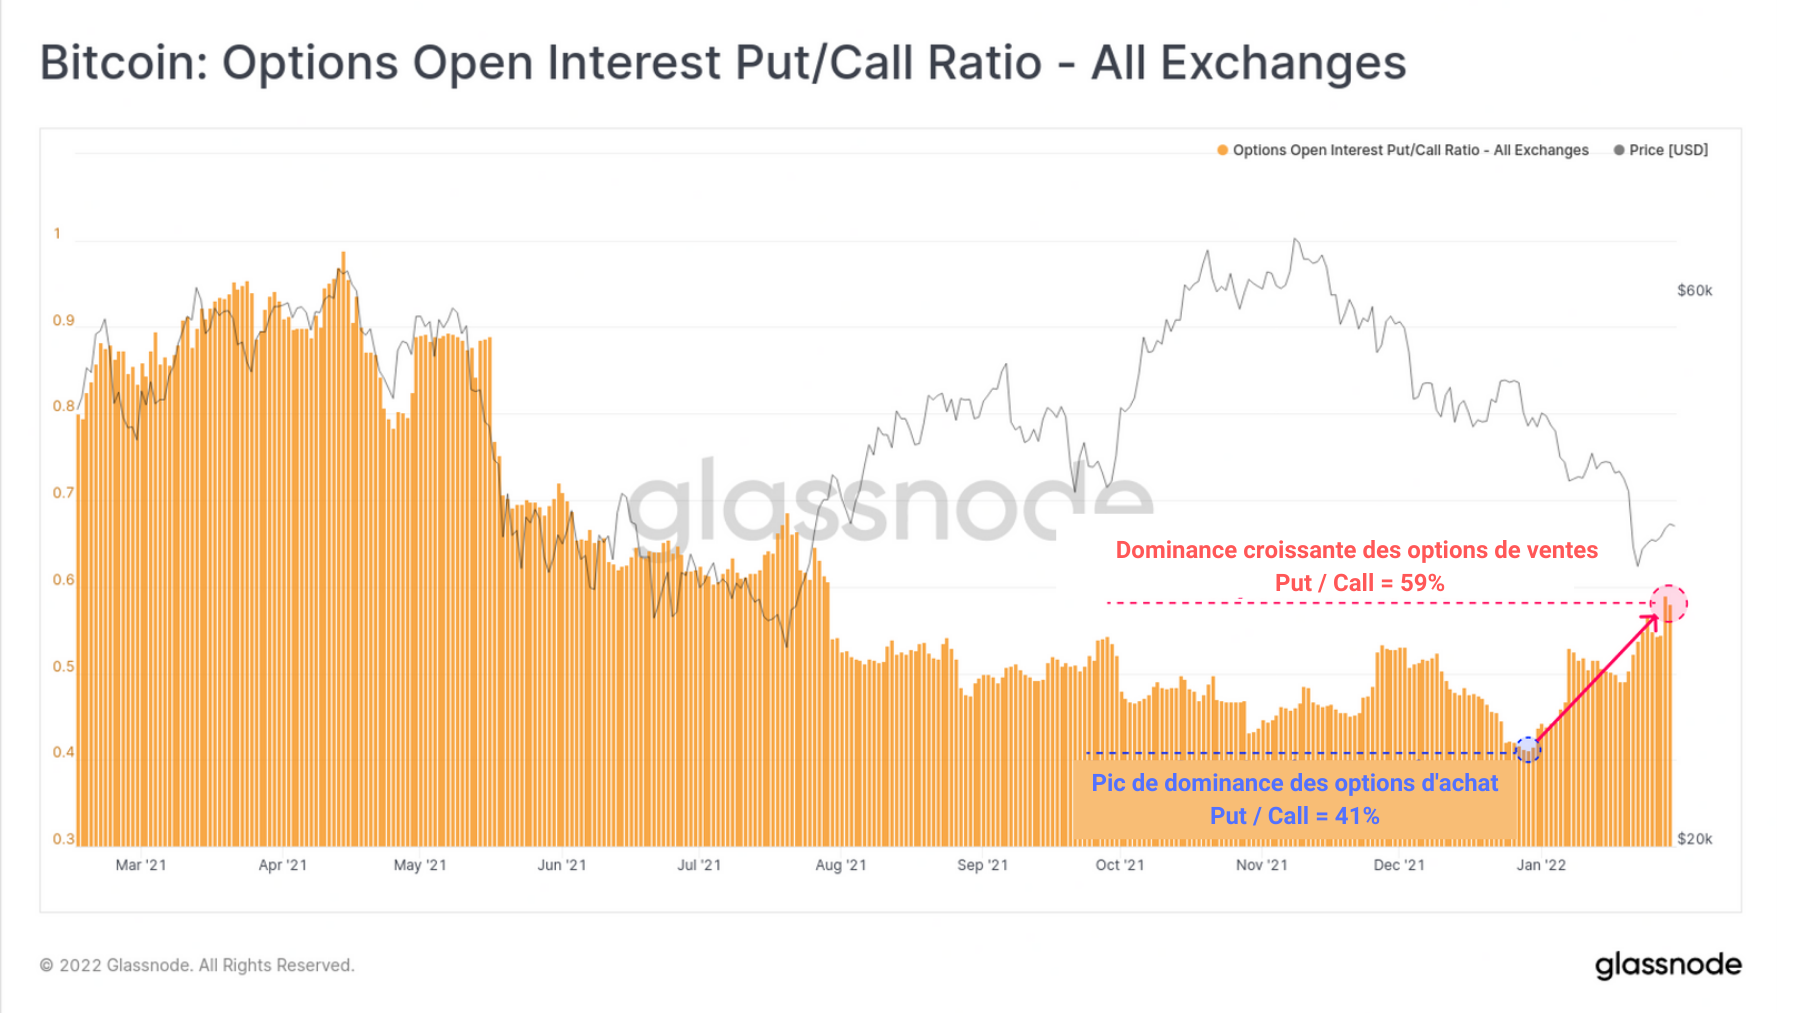
Chart of bitcoin put/call options ratio dominance
With this observable movement of the bias in the derivatives markets, the dominance of short liquidations could exceed monthly records in the event of high volatility.
In the face of a bearish bias and high leverage , a reasonable case could be made for a potential short squeeze should new capital flows flow into BTC.
Bullish momentum divergence
If this eventuality materializes, it could be the trigger for a trend reversal worthy of the recovery of July 2021.
This surge would allow the realized market gradient (MRG), an indicator that tells us about market momentum , to converge upwards on three time scales.
As seen below, the MRG-14 indicates a bullish divergence between BTC price and its short-term momentum. Forming a low point higher than the previous one, this oscillator signals that the market is struggling to maintain its downside strength .
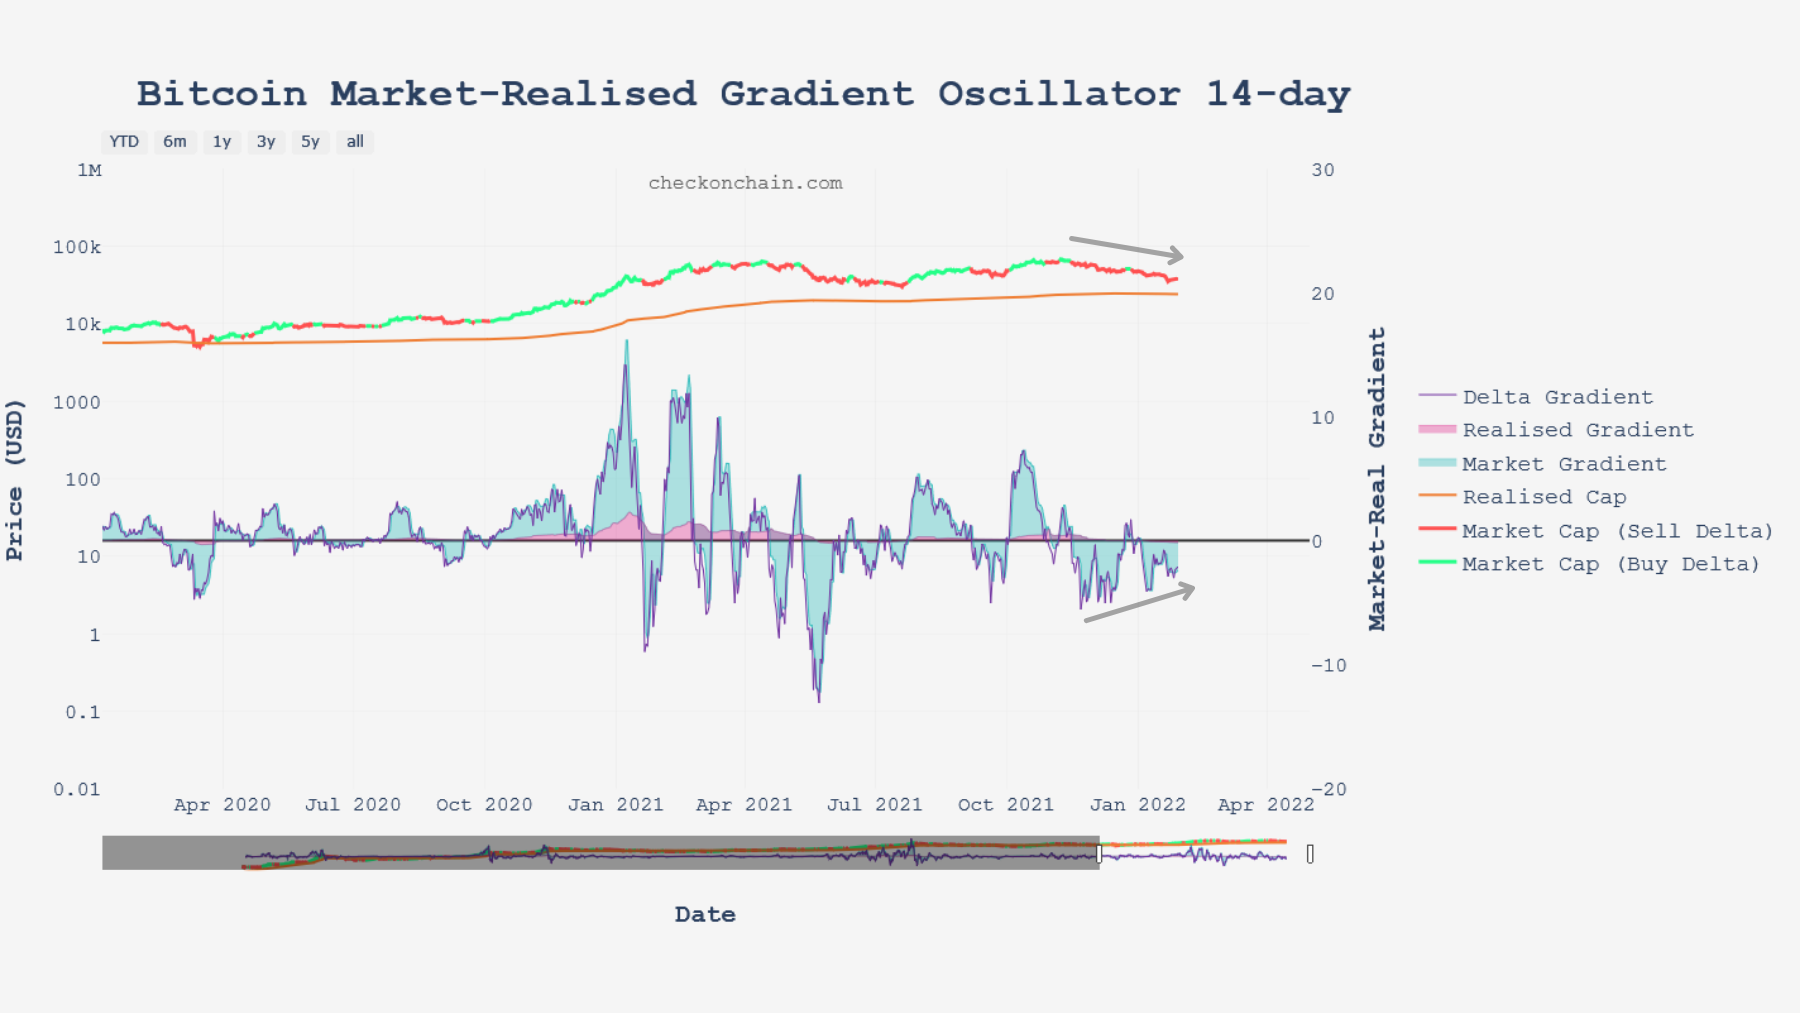
Chart of bitcoin’s MRG-14
On a medium-term horizon, the observation is the same: the downward momentum is losing power and the gradient achieved is approaching the zone of neutrality which will have to be crossed as resistance in order to confirm a serious directional change.
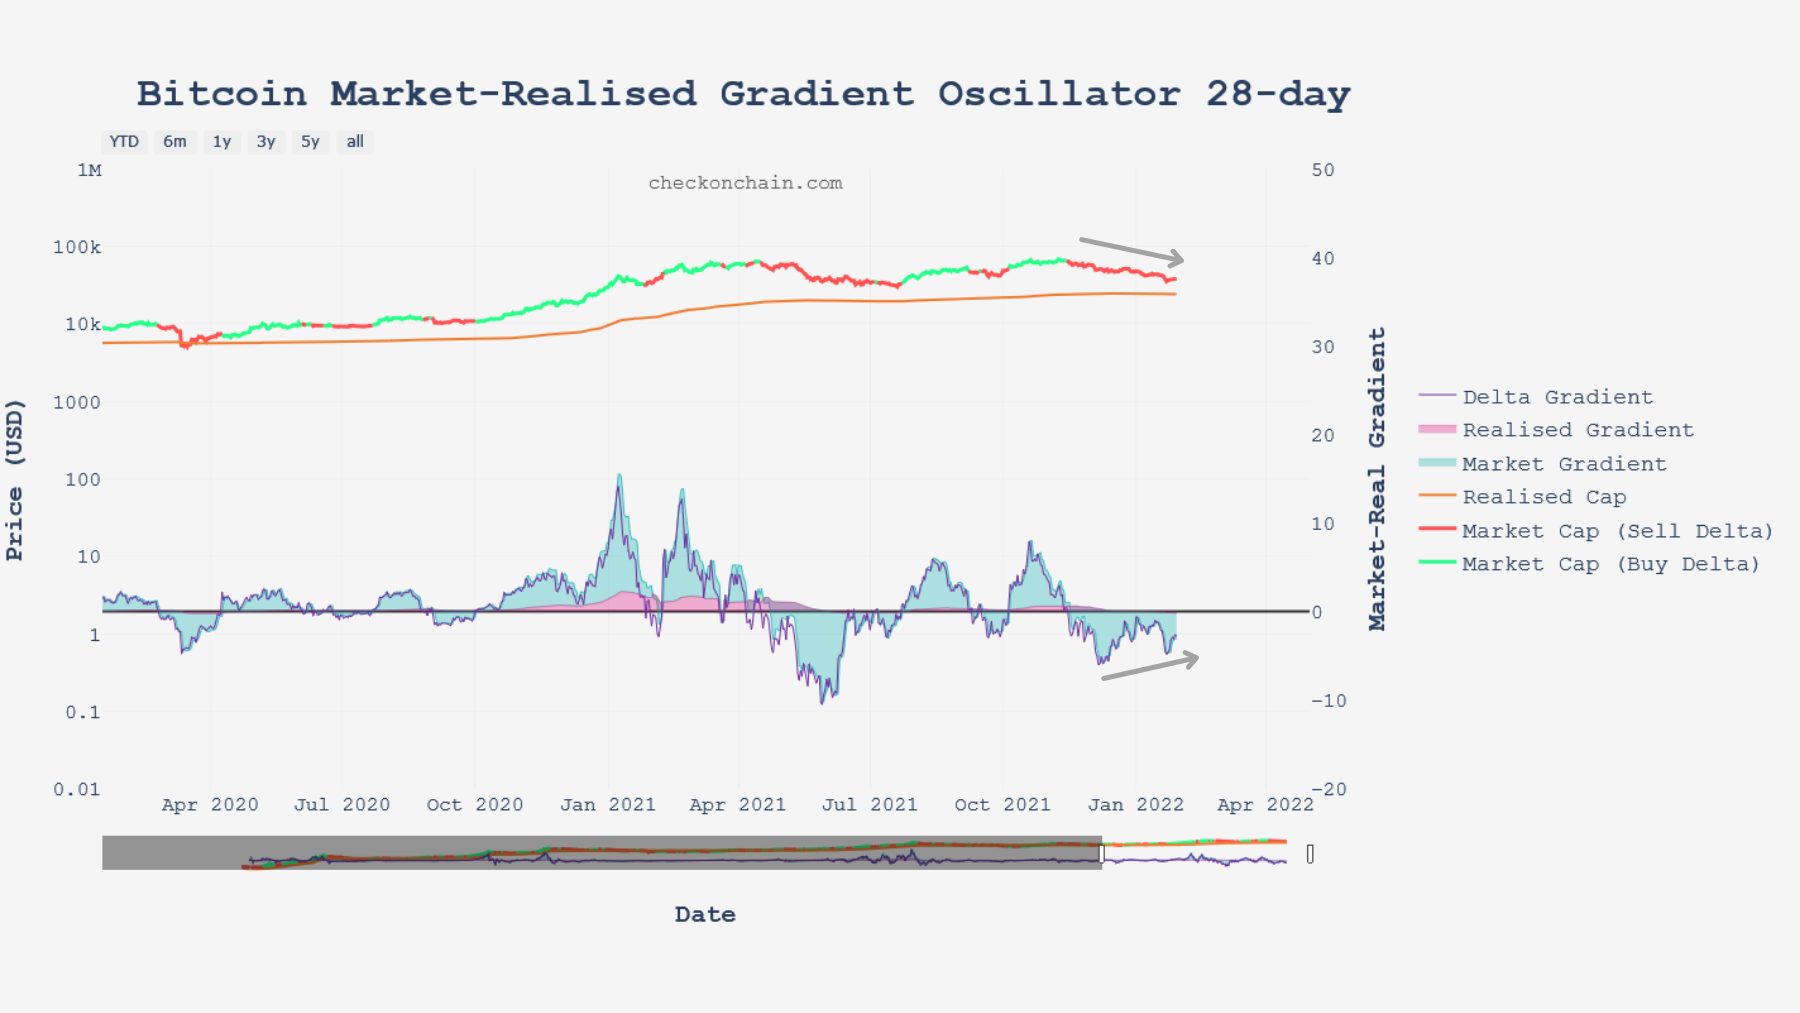
Bitcoin MRG-28 Chart
Finally, the confluence of these two oscillators could not be complete without the alignment of the MRG-140 , proxy of the long-term momentum .
The latter seems about to form a trough which could turn into a bullish recovery signal if it were to print positive values again. From this point of view, bitcoin shows predispositions to reverse its trend and
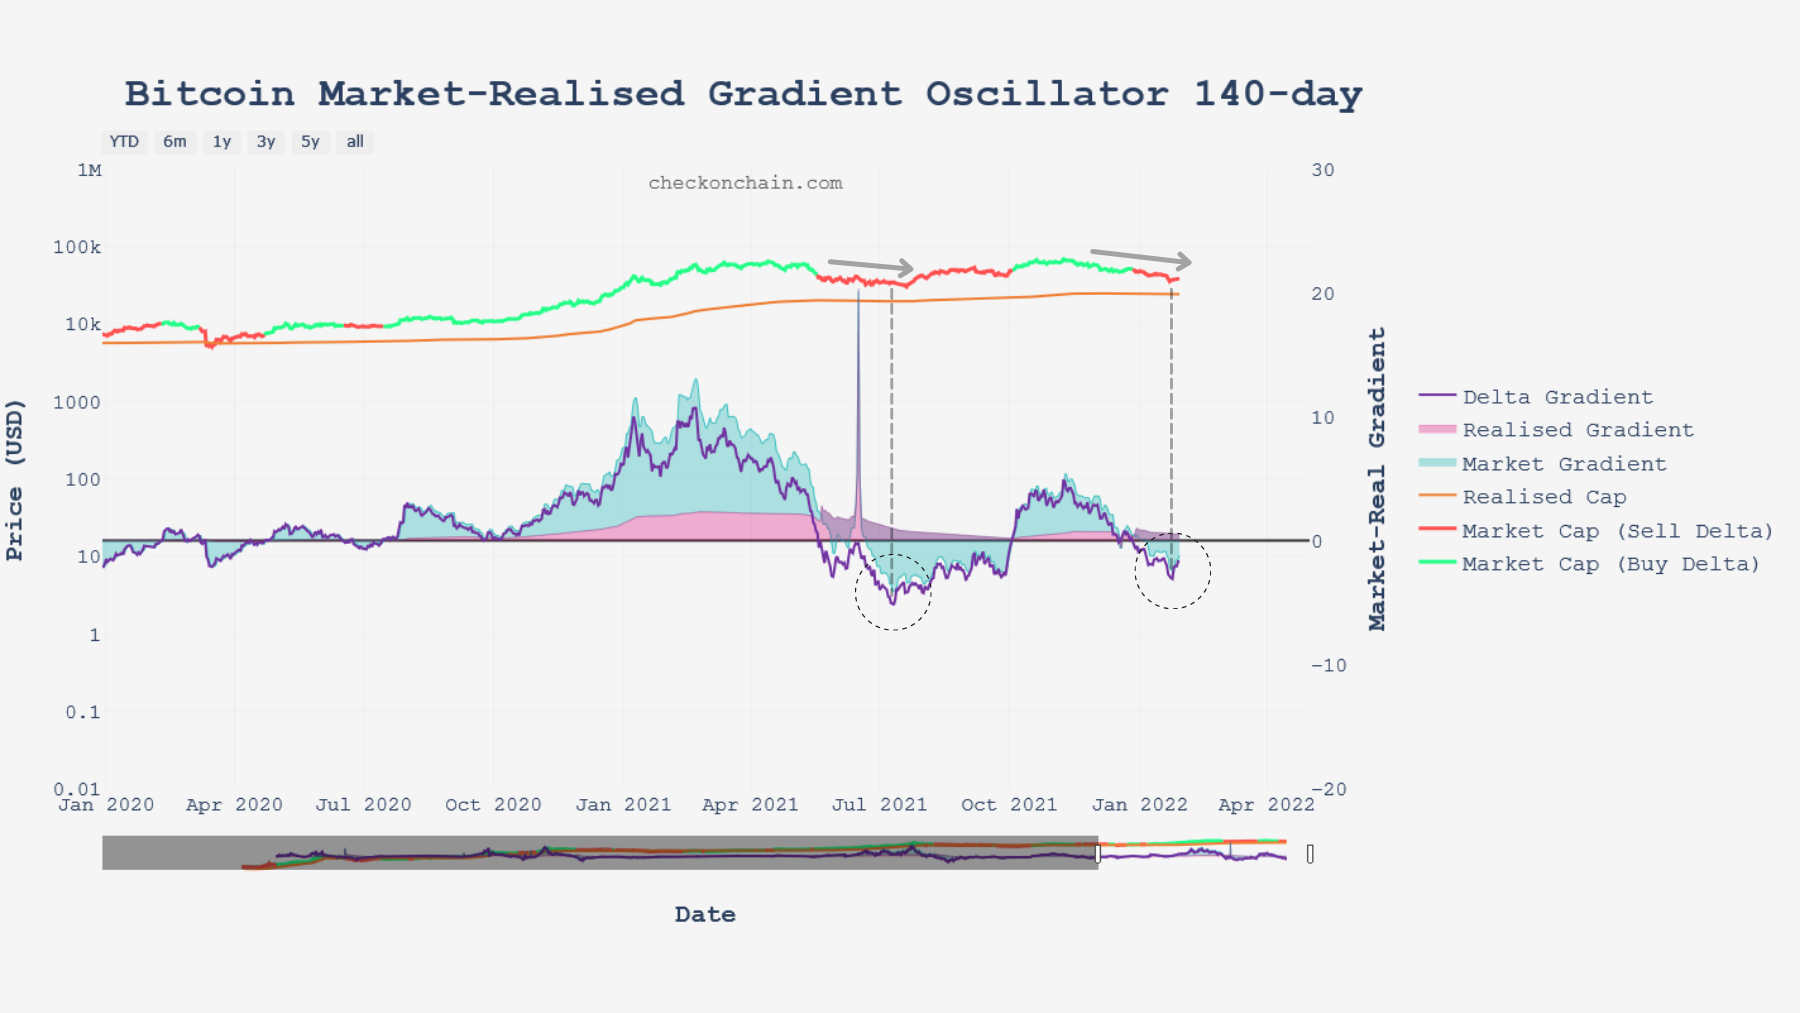
Bitcoin MRG-140 chart
Summary of this on-chain analysis
Finally, the bitcoin market ends the month of January on a note of optimism . Although it is too early to seriously declare that a trend reversal is at work, many indicators suggest that the market is preparing for it by adopting a structure opposite to that of the end of 2021.
As accumulation is in full swing and a large portion of investors are emptying reserves from exchanges, the use of the chain suggests that the value of the network is undervalued to a point only manifesting on rare occasions. .
And as speculators enter bearish positions in anticipation of an upcoming decline, the risk of short squeeze and could initiate a momentum reversal across multiple timeframes.
Little by little, favorable conditions are being put in place, but we still have to wait to observe more confluence between the indicators of other aspects of the chain that we will detail in the next analysis.