An alternative form of market analysis is intriguing within the crypto community, on-chain analysis. By studying and equating data from a blockchain, on-chain analysis proposes to analyze its fundamentals. Let’s explore this discipline and its applications, in particular for Bitcoin (BTC).
- On-chain analysis, a discipline for studying blockchains
- A statistical approach to market behavior
- The multitude of relevant indicators of on-chain analysis
- An abundant on-chain data offer
- Our opinion on on-chain analysis

On-chain analysis, a discipline for studying blockchains
Since Bitcoin ‘s (BTC) inception in 2009 and its IPO a decade later, its inability to relate to traditional asset classes has deterred many investors from embracing it and many analysts from studying it.
Turning away from this asset with its unique attributes as a cryptocurrency, many institutions then renounce the study of the fundamentals of Bitcoin (the blockchain) and bitcoin (the currency).
However, by taking advantage of the transparency offered by open blockchains, with on-chain analysis , it is now possible to measure the health of a network , the structure of a market and the behavior of the various players that make it up.
Opening a new perspective to analysts of emerging monetary assets such as cryptocurrencies, on-chain analysis is a discipline offering to quantify and qualify behavior on the blockchain .
Sometimes confused with monitoring and chain analysis, seeking to identify and trace entities, this method does not target the identity of participants, but their behavior and their responses to market and network stimuli.
Present since 2011, but brought to the general public in 2017 by pioneers in the field such as Willy Woo or Nic Carter, on-chain analysis thus takes advantage of the data contained within Bitcoin transactions and blocks in order to analyze their fundamentals.
A statistical approach to market behavior
Blockchains create a wealth of economic information open to everyone on a daily basis. However, despite their ease of access, these data, known as “on-chain”, in their raw form, provide information with limited interpretations .
While anyone can potentially create their own databases from the Bitcoin blockchain, many individuals access raw or contextualized data from on-chain data providers, discussed below.
On-chain analysis is therefore above all a mathematical discipline making it possible to create heuristics and statistical analysis methods for the open data contained within a blockchain.
For example, a commonly accepted heuristic within the on-chain community is the distinction made between:
- long -term investors (LTH for “long term holder”);
- short -term investors (STH for “short term holder”).
These two cohorts are the result of a statistical study of the spending behavior of UTXOs on the Bitcoin blockchain, which made it possible to quantify the probability that an entity would spend its satoshis or, conversely, save them.
Indeed, by studying the age of UTXOs at the time of their expenditure, Glassnode determined in 2020 that an address (representing an entity) holding an aged UTXO exceeding 155 days will be statistically less likely to spend it in the future.
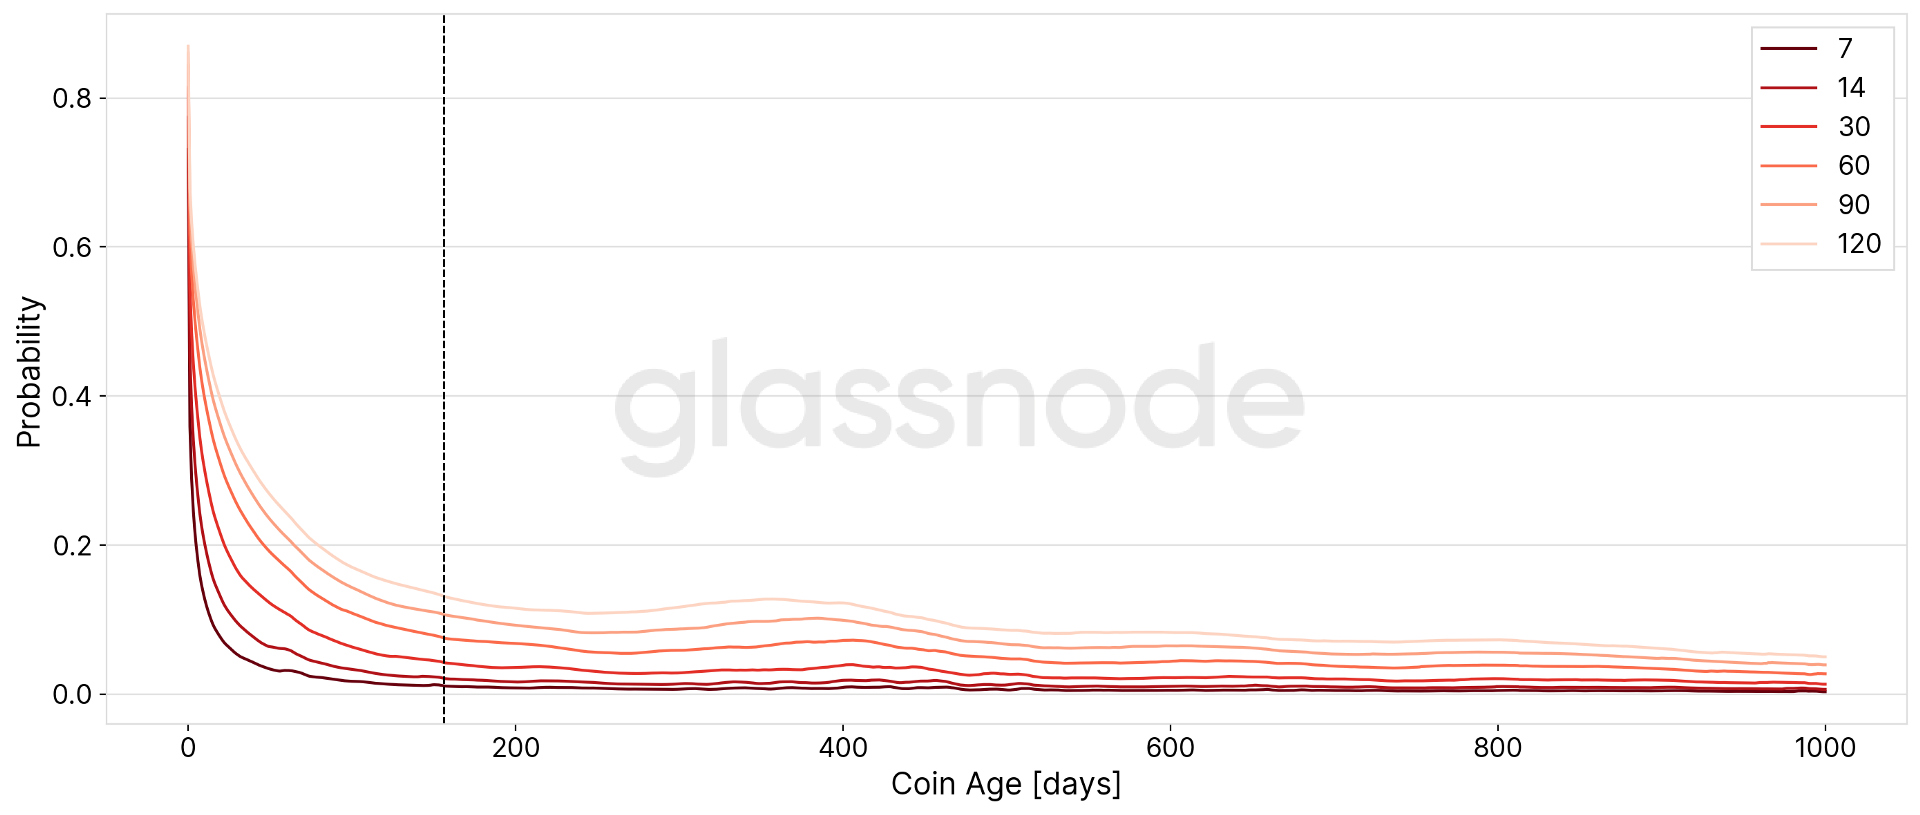
Figure 1: Probabilities that a UTXO will be spent within the specified time window as a function of its age
This data then made it possible to distinguish two distinct responses of these cohorts to the same stimulus according to the age of expenditure:
- UTXOs of less than 155 days are very sensitive to the emotionality of the market and have a high probability of spending on the order of several days or weeks;
- UTXOs over 155 days tend to be accumulated and stored for months or years and are associated with rational behavior and strong conviction.

The multitude of relevant indicators of on-chain analysis
Studying the vital parameters of a blockchain, the market structure of its coin/token as well as the psychology of its participants offers a serious advantage due to the wealth of information that on-chain data offers.
Although on-chain analysis remains a minority compared to technical analysis or even the Ichimoku method, a handful of on-chain indicators can often provide a much clearer view of the market at a given time than the majority of conclusions . drawn by traditional methods.
Since this discipline is based on the study of on-chain data and not only on the price movements of a cryptocurrency , it provides a wide-angle view of the overall dynamics of a market.
In order to illustrate this fact, here is a brief presentation of three of the oldest and most relevant on-chain indicators.
Coins Days, or “Coins Days”
Indicator discussed by an entity with the pseudonym of ByteCoin on the Bitcointalk forum in 2011, the objective of Days of Coins is to measure the time elapsed between the creation of a UTXO and its destruction .
Once the UTXO is destroyed, its Coin Day count is reset to zero and a new count can begin.
From this method was later introduced a metric called “Day of Destroyed Coins”, allowing to observe the spending behavior of BTC according to their age.
It is thus possible to identify periods of significant destruction, signs of profit taking of old BTC during bullish phases (green circle) or moments of panic during capitulation (red circle).


Figure 2: Days of Parts Destroyed

https://www.huobi.com/en-us/topic/double-reward/?invite_code=2f8b5223
The NVT Signal, or “Network Value to Transactions Signal”
Developed in 2017 by Dmitry Kalichkin, this indicator is a variant of the NVT ratio created shortly before by Chris Burniske and Jack Tatar.
The standard NVT ratio represents the value of the network in dollars divided by the daily volume of transactions carried out on the network , smoothed using a moving average.
Dmitry’s trick was to apply a 90-day moving average to trading volume alone, producing a chart responsive enough to be used as a meaningful indicator of the Bitcoin network’s utility value.
This is probably the first trading indicator to use blockchain data instead of price or volume data from exchanges.

Figure 3: NVT Signal
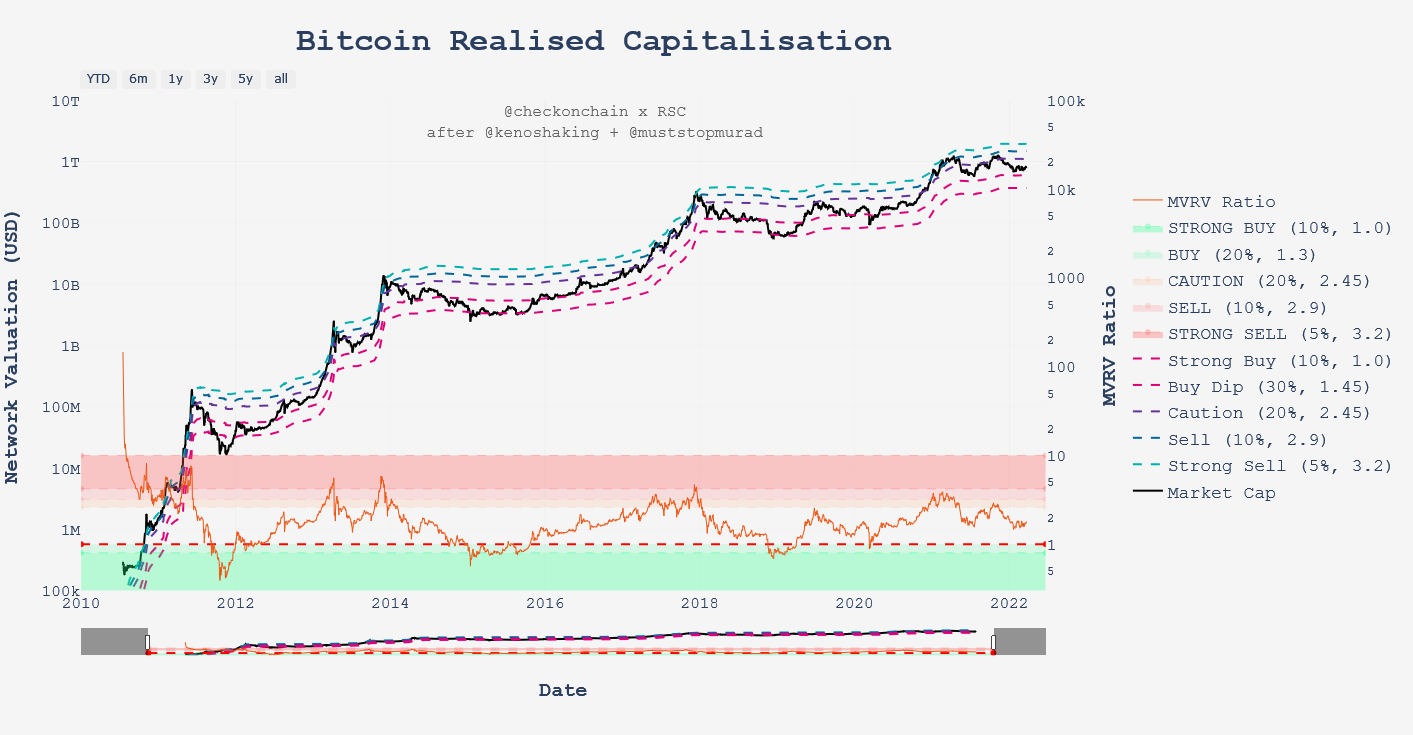
Realized Capitalization or “Realized Cap”
Introduced by CoinMetrics in 2018, this metric was created to fill the lack of relevance of market capitalization for the study of distributed assets.
While market capitalization implicitly assumes that all BTC are active on-chain, the fact is that many BTCs are actually illiquid and dormant, or even lost forever.
Realized capitalization filters out day-to-day market noise and helps measure a more authentic value of the asset by multiplying the price of BTC at the time of the last UTXO creation by the units of BTC in circulation .
This metric effectively represents the collective cost base of all BTC holders and proves to be meaningful in signaling rare buying opportunities.

Figure 4: Realized Capitalization
An abundant on-chain data offer
Drawing from the blockchain via various heuristics, on-chain data providers offer an alternative to entities that cannot operate their own Bitcoin node or their own method of analyzing and sorting data. Their function is to provide access to data, raw or contextualized, mainly from transaction and block data.
Today, Cryptoast offers you a non-exhaustive list of entities offering, free or not, access to on-chain data:
checkonchain
Developed by Checkmate, senior analyst at Glassnode, checkonchain brings together free and open-source a lot of on-chain data relating to the Bitcoin (BTC) network, but also to Decred (DCR), Monero (XMR) and Horizen (ZEN).
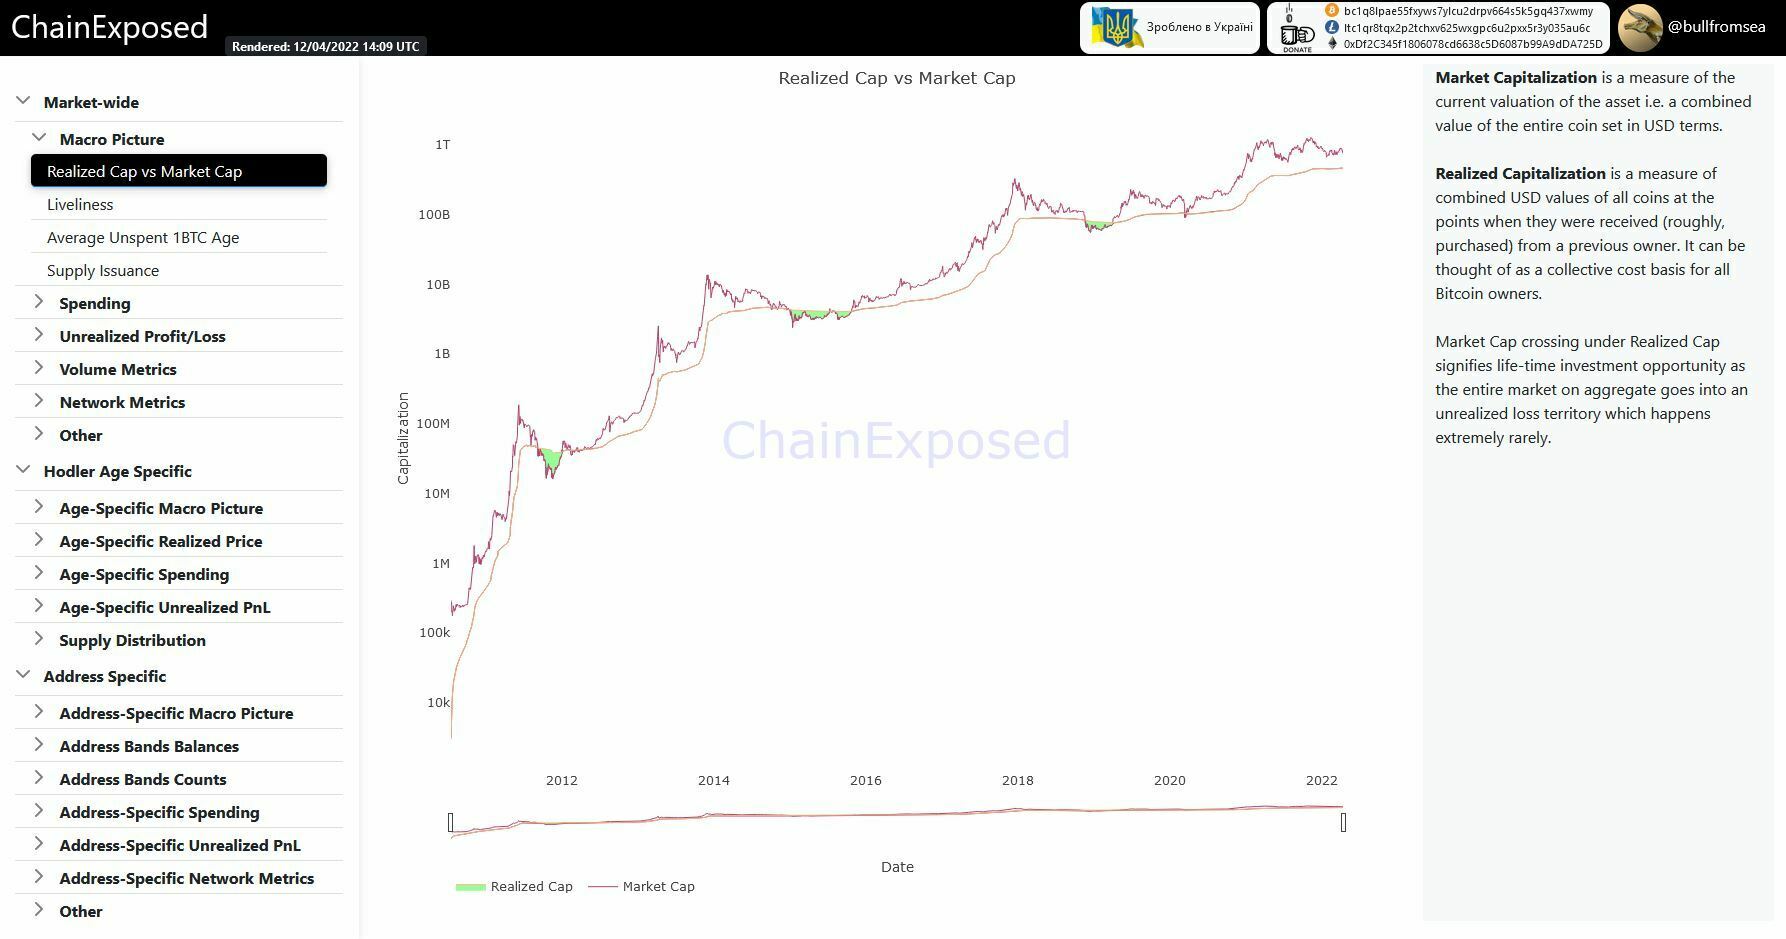
ChainExposed
Created by an entity known as bullfromsea, ChainExposed compiles a lot of contextualized on-chain data and is full of fascinating metrics. However, the heuristics used to develop these indicators are not detailed there.
CoinMetrics
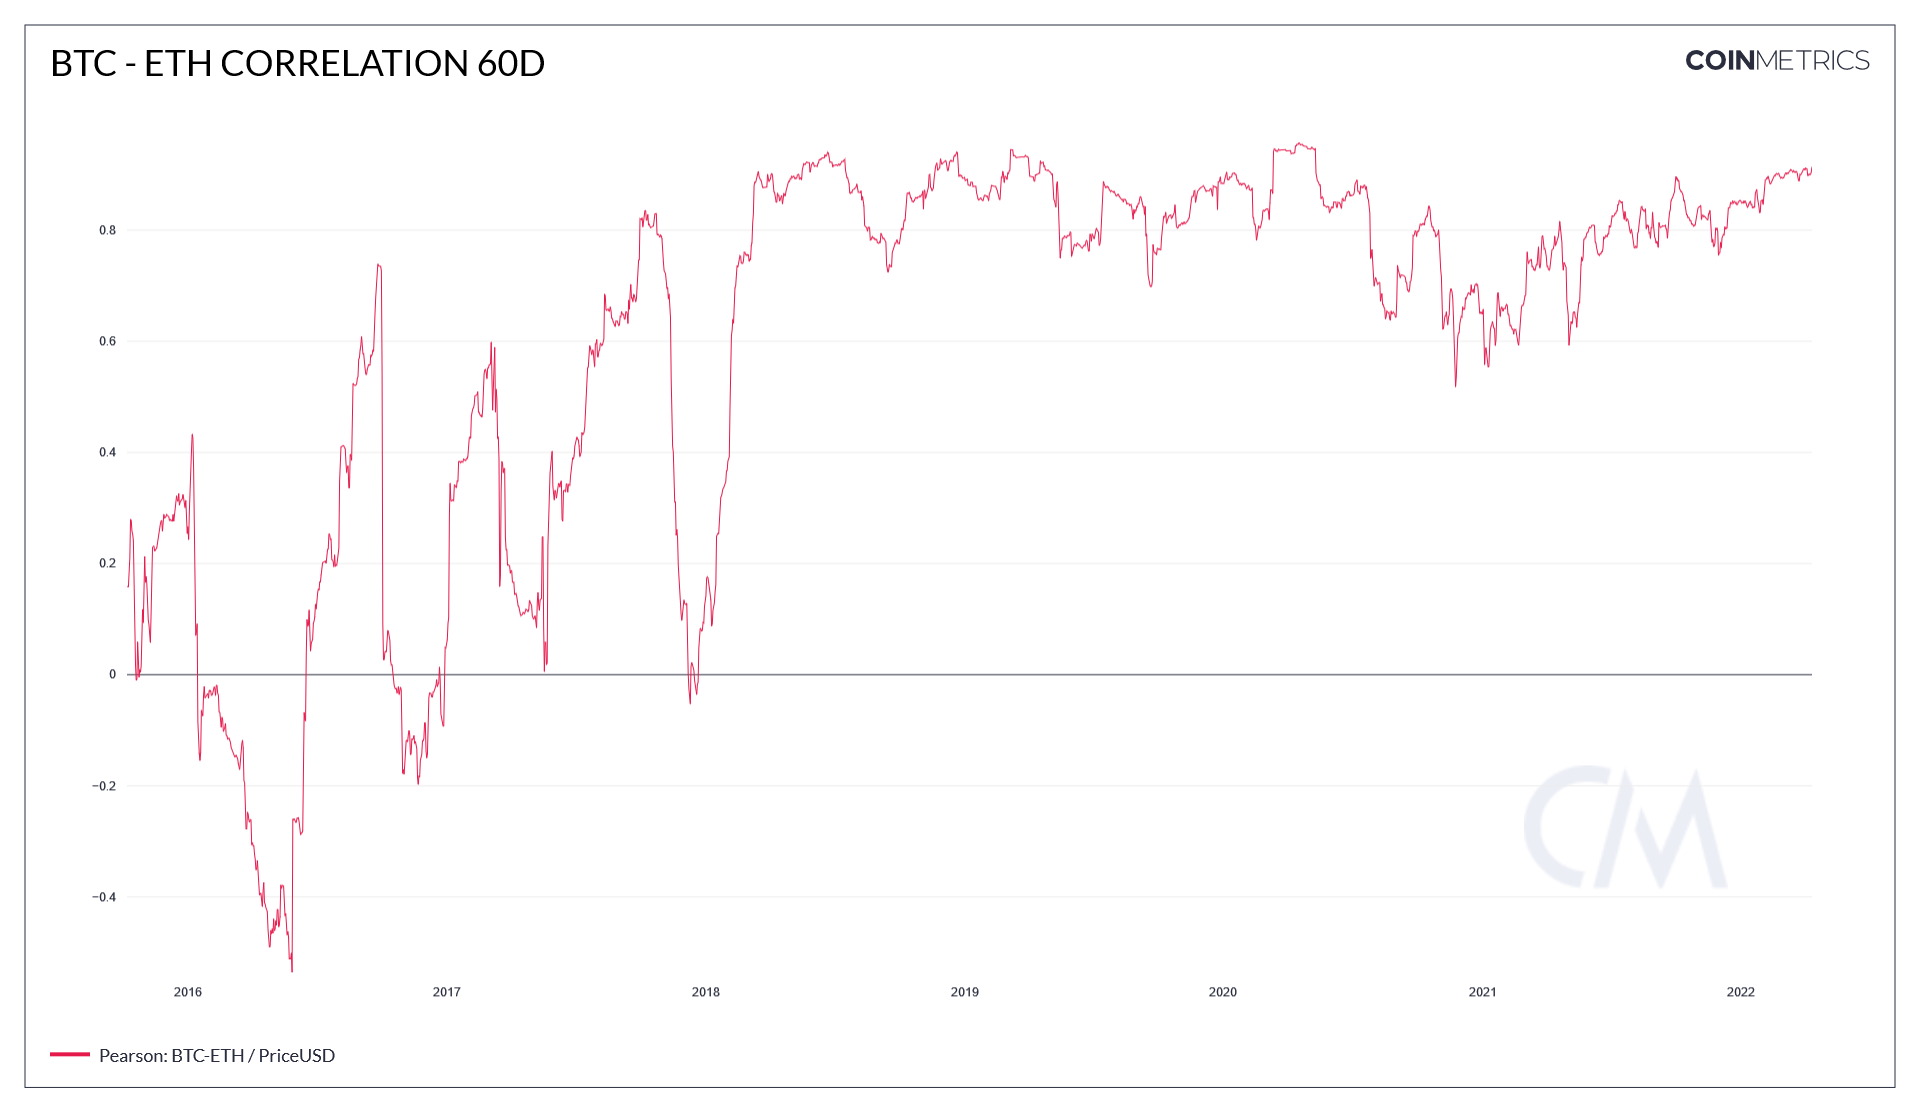
CoinMetrics provides free data on over 40 cryptocurrencies , including on-chain indicators and correlations. A pioneer in the development and application of on-chain data, the firm writes a weekly newsletter highly appreciated by institutional investors.
Glassnode
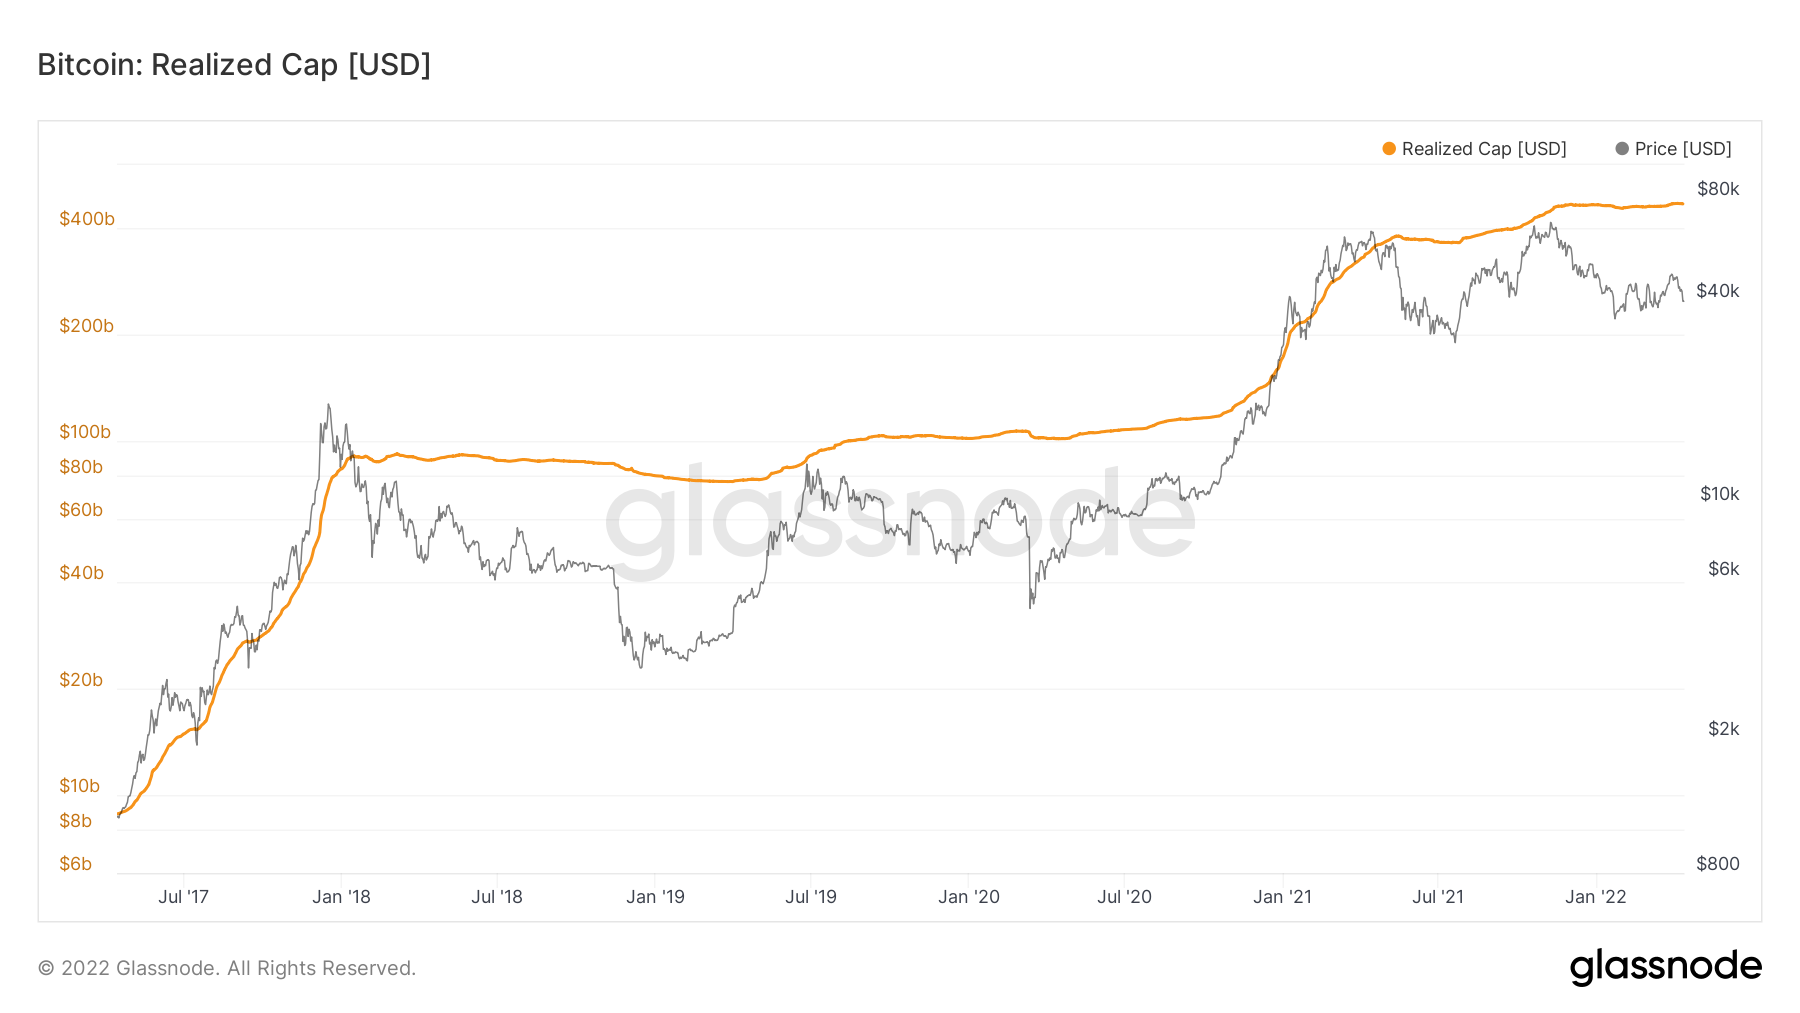
Another pioneer of on-chain analysis, the Swiss firm Glassnode offers free access to classic on-chain metrics , but also a complete suite of paid on-chain tools allowing an advanced study of movements on the chain of Bitcoin and many other cryptocurrencies.
A feature that appeared in 2021, called “Workbench” even allows you to create countless metrics from basic on-chain components.
CryptoQuant
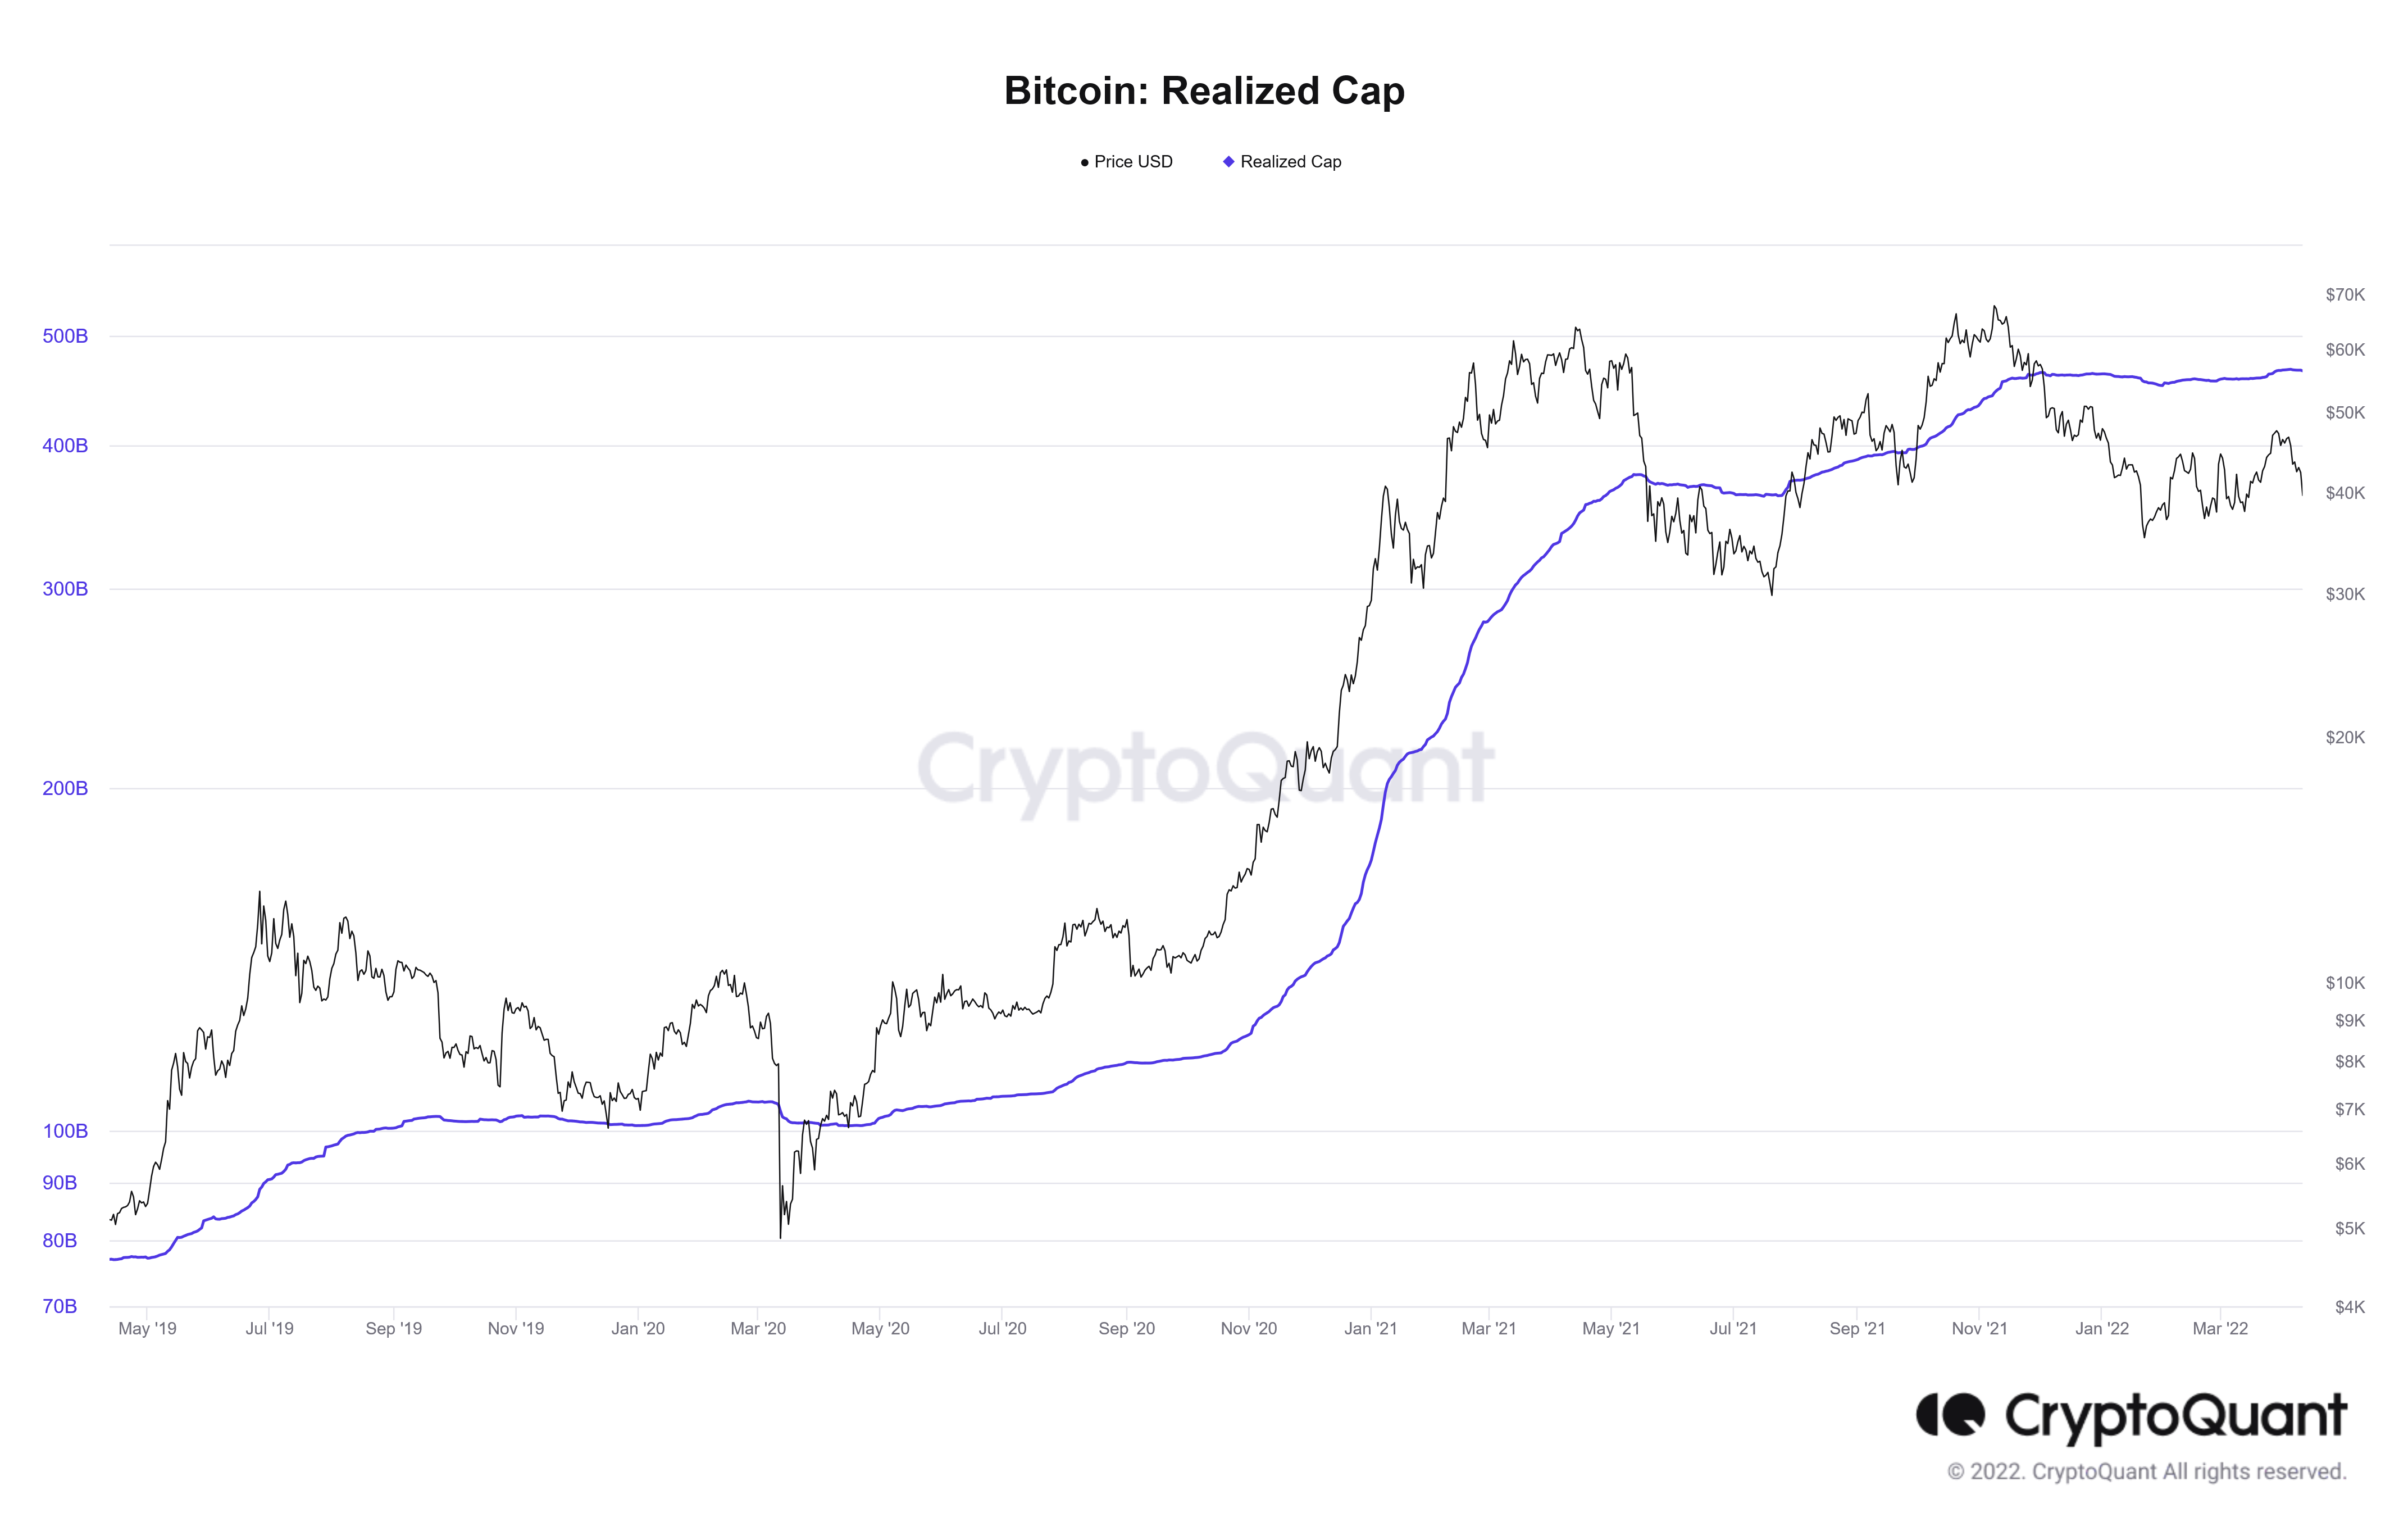
The South Korean firm CryptoQuant is positioned as the closest competitor to Glassnode due to the large data offer that its platform offers.
Its “QuickTake” space offers anyone creating an account the opportunity to write, read and share various analysis formats with the rest of the community.
IntoTheBlock
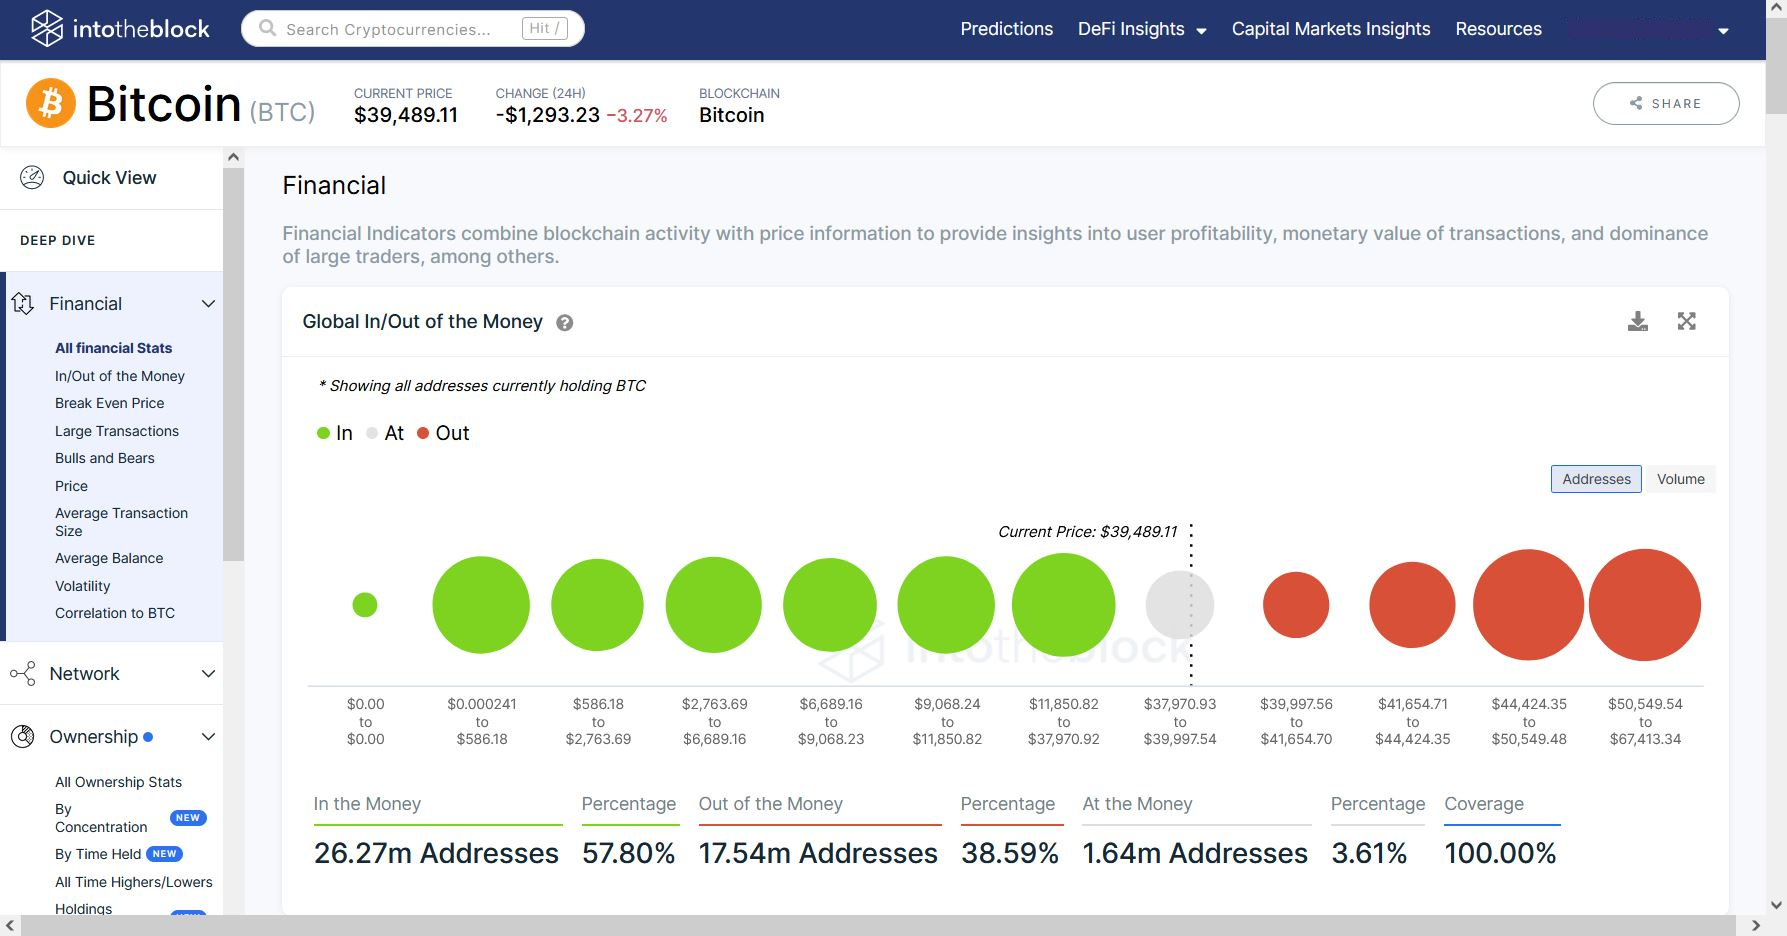
IntoTheBlock offers a range of analytical tools covering a wide variety of cryptocurrencies , as well as order book and social media sentiment data.
Dune Analytics
Notably renowned for its metrics relating to decentralized finance (DeFi) on Ethereum and altcoins, Dune Analytics is an open-source and free platform offering anyone a wide variety of dashboards, metrics and visualization covering a wide spectrum. sectors of the Bitcoin and cryptocurrency ecosystem.

Saniment
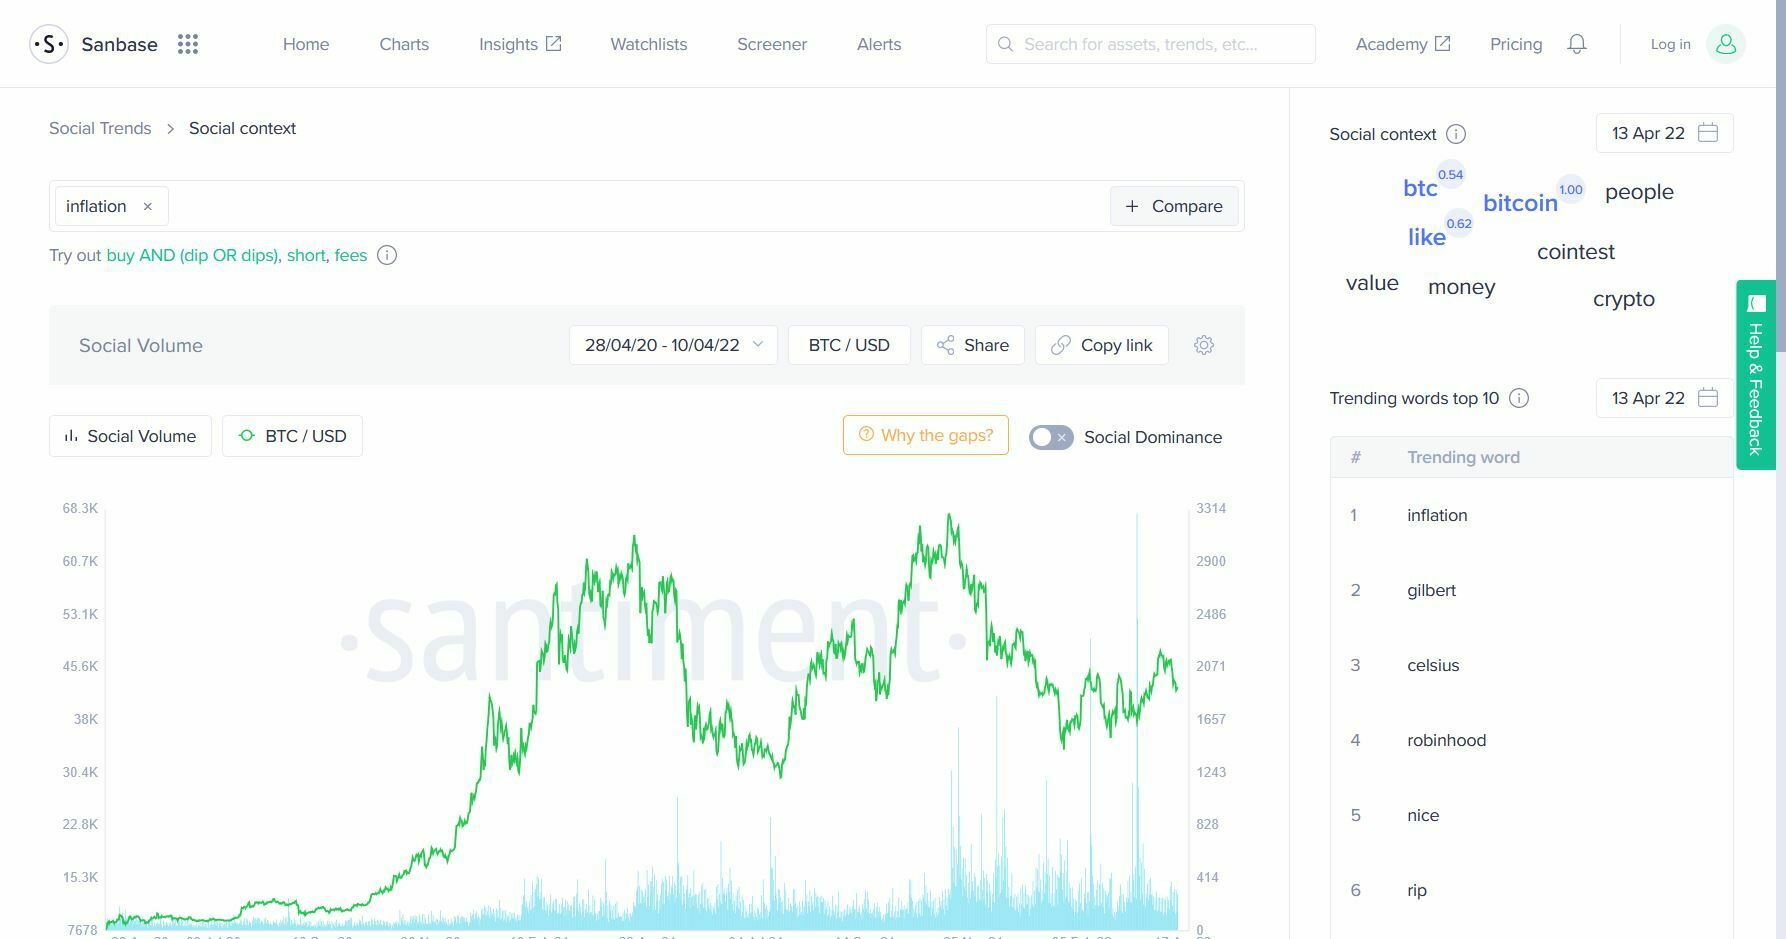
Santiment and their Sanbase product offer analysts a wide range of social sentiment data . Measuring emotionalism and the bias of social networks like Twitter, GitHub or even Instagram, this platform is essential for gauging the social commitment of investors.
Our opinion on on-chain analysis
On-chain analysis is an alternative form of market analysis dedicated specifically to the study of open blockchains . A nascent discipline offering to quantify and qualify the behaviors of the blockchain, it is currently experiencing significant growth.
If this new prism still arouses the skepticism of many investors of the old school, the contribution of this discipline to the understanding of the dynamics of networks and distributed markets is undeniable today .
While on-chain analysis produces high-quality, actionable signals for long-term cycles , short-term traders can still benefit from more granular data, accessible by running their own full node.
However, despite its advantages, it is still in its infancy and it is not impossible that current data and heuristics will become obsolete within a future macroeconomic framework.
Likewise, comparing the metrics of multiple crypto-assets requires careful interpretation. All blockchains are not equal and do not necessarily archive the same information, nor in the same way.
On the other hand, Tier 2 scaling solutions such as the Lightning Network have the potential to reshape transaction volume as currently measured on-chain, by skewing indicators that rely on this datum.
The interpretation of on-chain indicators will therefore have to adapt over time to take into account these changes in market activity and structure.


https://www.huobi.com/en-us/topic/double-reward/?invite_code=2f8b5223
