Becoming a liquidity provider can allow you to earn interest from your cryptocurrencies rather than letting them sit on your wallet. As we saw in our previous article , while this method can be very profitable, it nevertheless involves significant risks. We will see in this article what this strategy consists of and how to implement it with a concrete example, after understanding and measuring the risks involved.
SUMMARY
- The principle of liquidity providing
- Difference between exchanges and Automated Maket Maker (AMM)
- Where does passive income come from when you are a liquidity provider?
- How liquidity pools work
- Constant market product algorithms
- Arbitration
- The slippage
- Intermittent losses
- How to predict intermittent losses easily
- The risks of liquidity providing
- Example: becoming a liquidity provider on the LUNA-UST pair
- Conclusion
THE PRINCIPLE OF LIQUIDITY PROVIDING
DIFFERENCE BETWEEN EXCHANGES AND AUTOMATED MAKET MAKER (AMM)
The difference that interests us here is the way in which the platforms will allow their users to exchange cryptocurrencies between them.
Trading platforms operate with an order book. It lists, at a given time, the buy and sell orders. When a buy and sell order matches, they are executed and exit the order book. The role of the platform is to connect a buyer and a seller who agree on the price.
Automated Market Makers work with liquidity pools (liquidity reserves). These pools are reserves of liquidity in which we find the different assets that can be exchanged between them. The relative price of different tokens is calculated algorithmically. Users who wish to make an exchange deposit the token they want to part with. They take the one that interests them in return. There are no sellers but liquidity providers who lend their tokens in order to make trading possible.
WHERE DOES PASSIVE INCOME COME FROM WHEN YOU ARE A LIQUIDITY PROVIDER?
When an exchange takes place on an AMM, a percentage of the amount is deducted from the person making the exchange. This fee is used to remunerate those who provided liquidity to the pool. The more exchanges there are, the more the liquidity providers earn.
Some platforms increase the revenue received by adding a percentage of rewards paid with their own token. This incentivizes more people to provide liquidity.
HOW LIQUIDITY POOLS WORK
As we wrote above, the relative price of the different tradable tokens within a pool is calculated algorithmically. The mathematical formulas which allow this to be done vary from one marketing authorization to another. Here we will describe the operation of the most common algorithms that have been popularized by Uniswap. This exposes liquidity providers to a problem that is essential to understand: intermittent losses .
Constant market product algorithms
We consider here a pool that contains 2 tokens (X and Y) that can be exchanged against each other. Users wishing to provide liquidity to these pools must do so with a 50/50 ratio in value. For the more scientific among you, the algorithm we are studying (called constant product market maker ) is based on the following mathematical formula:
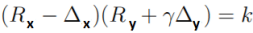
- Rx and Ry : number of X and Y tokens
- Δx and Δy : variation in the number of tokens x and y
- γ : transaction costs
The value of k increases over the exchanges due to transaction costs. We will not take it into account for the following. In order to explain how these pools work, we will content ourselves with the following simplified formula:
x*y=k
- x : number of cryptocurrency tokens X
- y : number of tokens of cryptocurrency Y
- k : total number of tokens which must remain constant
The curve below shows what happens within the pool when a user exchanges X tokens for Y tokens.
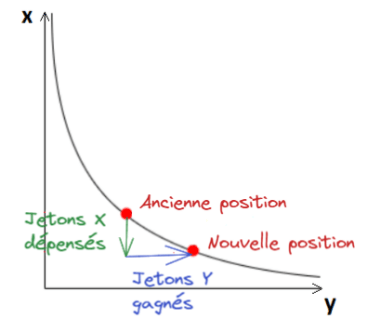
A change in the number of x and y tokens available in the pool also leads to a change in their price.
Indeed, the price is linked to the ratio of the 2 tokens. In other words, when token X is bought, its price increases, because the number of token X in the pool decreases. The Y token price decreases because there are more Y tokens in the pool.
Arbitration
This thus offers arbitrage opportunities that allow the prices of the tokens in the pool to be in line with those of the external market. Indeed, if an exchange lowers the price of token X so that it is lower than on another platform, an “arbitrator” will hasten to buy it from the pool (thus raising its price ) to resell it on another platform and pocket the price difference.
Here is a diagram for better understanding:
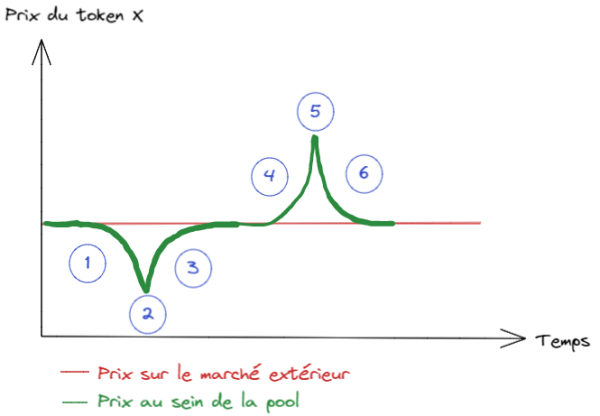
- A user withdraws token Y from the pool by depositing token X. The number of tokens X therefore increases and their price decreases.
- An arbitrator buys token X in the pool and resells it on the global market to pocket the profit
- The number of tokens X in the pool decreases (because of the 2) so its price increases.
- A user withdraws token X from the pool by depositing token Y. The number of tokens X therefore decreases and their price increases.
- An arbiter buys X tokens on the global market and sells them back to the pool to pocket the profit.
- The number of tokens X in the pool increases (because of the 2) so its price decreases.
The same opportunities with the same effects occur if prices vary in the market outside the pool.
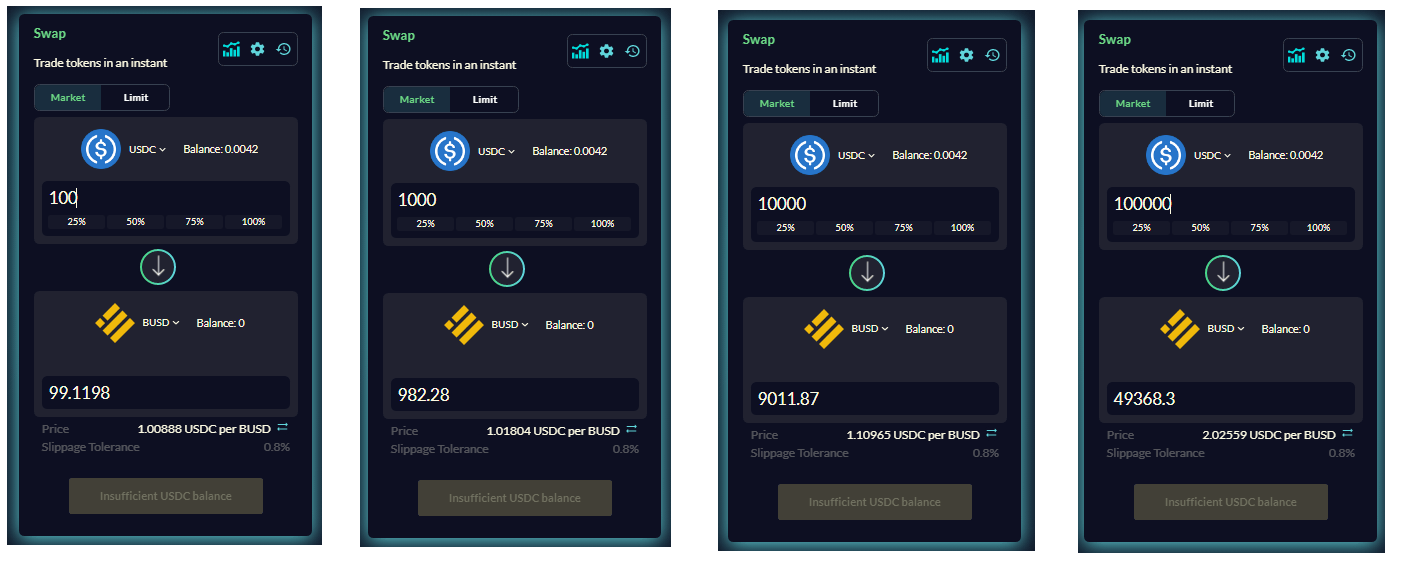
The slippage
This algorithm offers the advantage of allowing exchanges without maximum volume (x and y cannot be zero otherwise k would be zero). In practice, the greater the volume of tokens exchanged compared to the size of the pool, the more the price of the 2 assets will undergo a significant variation within the pool (this is slippage ).
This has the effect of dissuading a user from making an exchange that is too large (compared to the total volume of the pool).
Intermittent losses
The price variations of the tokens within the pool lead to so-called “intermittent” losses ( impermanent loss ). These losses are not permanent, as they disappear once the tokens return to the price they had when the liquidity provider deposited. They represent the difference in value between having provided liquidity to the pool and having simply kept the 2 assets in the portfolio.

Let’s take a concrete example to better understand:
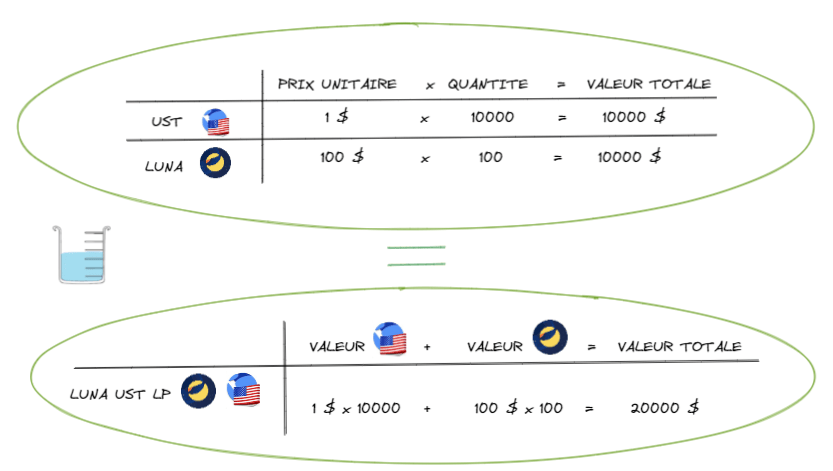
In the LUNA/UST pool on Terraswap, the ratio is 50/50. This means that the liquidity provider must bring as much UST as LUNA in value.
In exchange for its deposit, Terraswap gives the liquidity provider a Liquidity Provider Token (LP token).
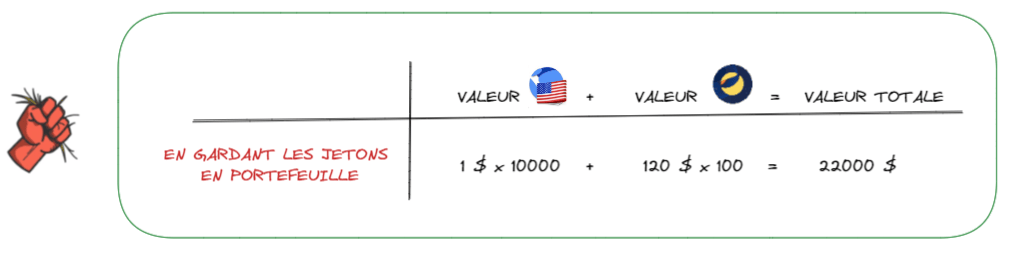
In the example below, we see that if a user deposits $10,000 in UST he must deposit at the same time 100 LUNA which are also worth $10,000. In exchange, Terraswap gives him LP tokens worth $20,000.
If the price of LUNA moves to $120 in the outside market, it creates an arbitrage opportunity.
An arbitrator comes to buy a maximum of LUNA at a price below $100 in the pool to resell them on the external market and pocket the profit.
The constant product market maker algorithm calculates that for the price of LUNA in the pool to reach $120, the arbiter can buy 8.7 LUNA for 954 UST. The 8.7 LUNA are out of the pool and the 954 UST are entering it.
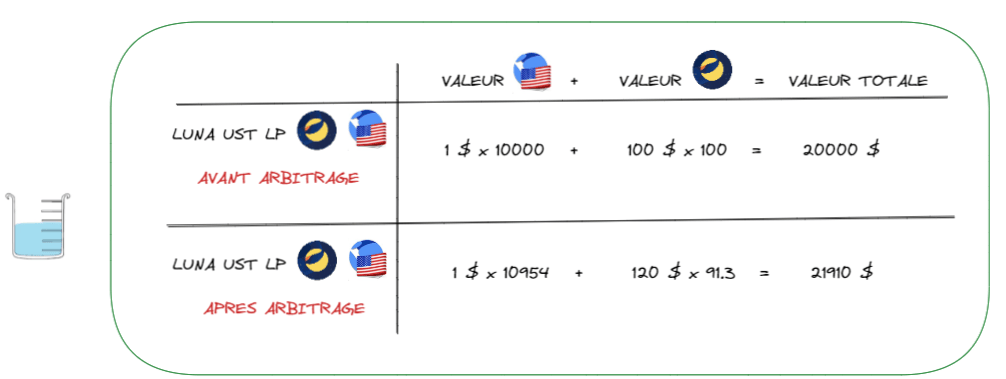
If the liquidity provider had kept its tokens in the wallet instead of putting them in the pool, they would be worth:
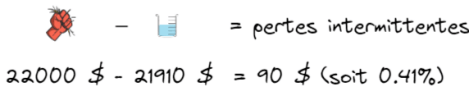
The intermittent losses are therefore worth:
How to predict intermittent losses easily
With this AMM model, intermittent losses exist whenever the price of tokens in the pool vary relative to each other.
Here is their evolution according to the price variation:
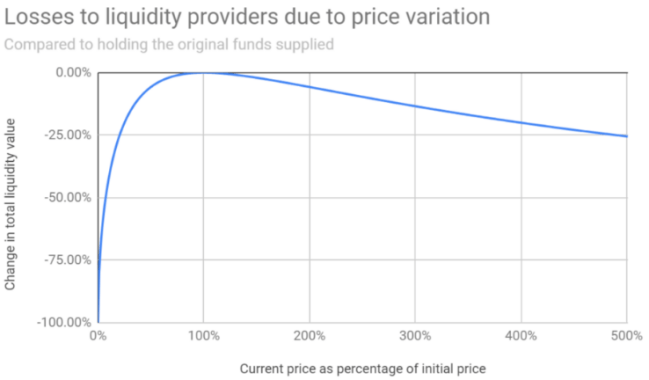
We can see for example that if the price of one token increases by 500% compared to the other, the intermittent losses will be 25%.
Fortunately, these losses can be compensated by the rewards provided by the AMM (this is the incentive to provide liquidity).
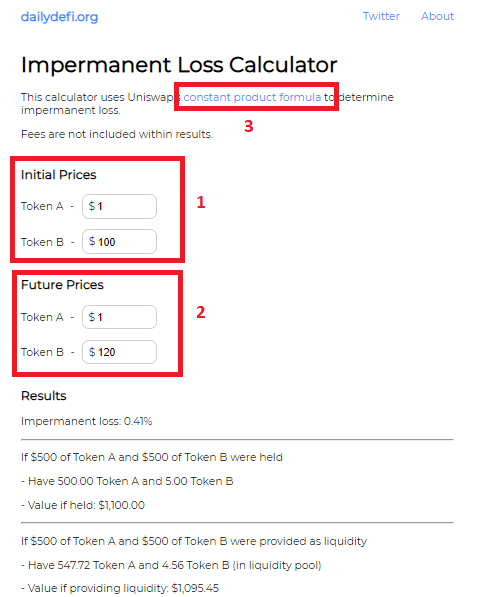
In order to avoid complicating your task, intermittent loss calculators exist. Just enter the initial price of your chips (1) and the final price (2) and they will give you the amount of losses. Be careful to choose a calculator that uses the algorithm of your marketing authorization (3)!
THE RISKS OF LIQUIDITY PROVIDING
As you will have understood, the main risk in being a liquidity provider is to expose yourself to a reduction in your gains or an increase in your losses due to intermittent losses.
The calculations we made in the previous paragraph are valid for AMMs operating with a constant product market maker type algorithm . Pay attention to the operation of the AMM to which you provide your tokens to correctly calculate the intermittent losses to which you may be subject.
Indeed, different types of MA have emerged. Platforms such as Curve, Balancer or Compound which have innovated with different models aimed at reducing intermittent losses.
The Lifinity.io AMM on Solana offers one of the most advanced versions available to date. A system of rebalancing the pools according to the evolution of the prices makes it possible to enormously reduce the intermittent losses.
This makes it possible to envisage that shortly the developers will have found the solution so that the liquidity providers are no longer subject to this risk.
Y ou can already avoid this by providing liquidity in pairs with a correlated price movement (stablecoins, LUNA-bLUNA, ETH-bETH, etc.) .
The other risks are those of hacking the platform to which you entrust your tokens and problems in the smart contracts.
You can also lose money if the price of your assets goes down, but this remains true whether you are a liquidity provider or not.
EXAMPLE: BECOMING A LIQUIDITY PROVIDER ON THE LUNA-UST PAIR
Prerequisites:
- Have installed a compatible Terra wallet (Terra Station Wallet, Ledger, Wallet Connect)
- Have LUNA and UST on your wallet
We will first compare which AMM pays the most on this pair.
To do this, we consult the coinhall.org site which lists the pairs and the rewards provided by the various AMMs of the Terra blockchain.
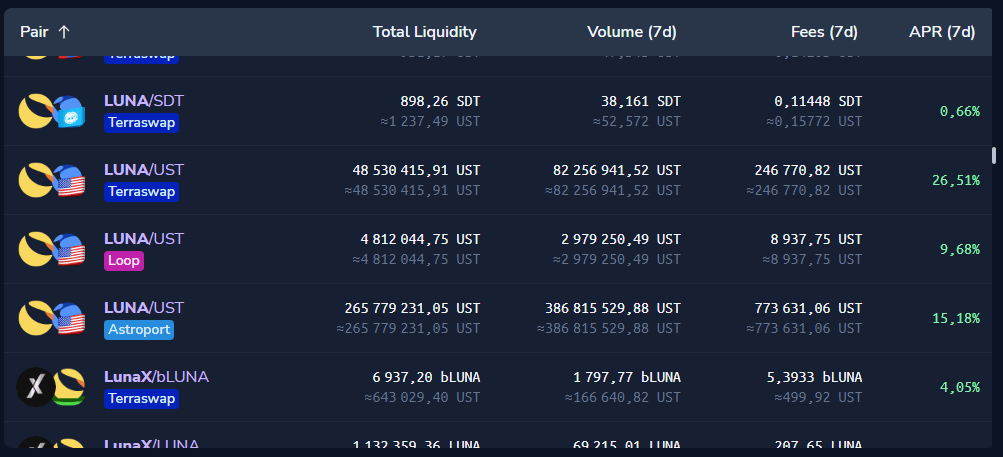
When writing this article, we can see that it is the Terraswap AMM that pays the most with an average APR ( Annual Percentage Rate = percentage of annual interest) over the last 7 days of 26.51%.
We will therefore provide our liquidity on Terraswap.
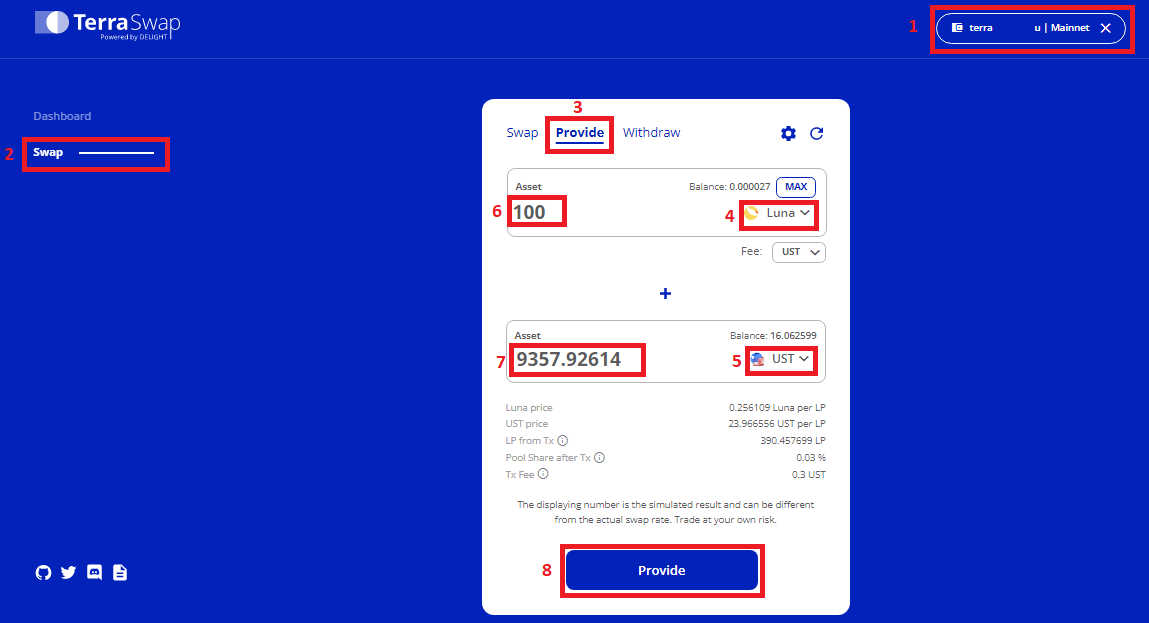
After connecting our wallet (1), we go to the “Swap” tab (2) then “Provide” (3). We then select the tokens that interest us (4) and (5). By entering the number of the first token (6), that of the 2nd will be filled automatically (7) in order to have a ratio of 50/50 in value.
We validate with the “Provide” button (8).
Terraswap charges a commission of 0.3% of the transaction amount. These commissions are deposited in the pool and shared among all liquidity providers. We collect them in LUNA and UST when we claim our funds.
We need to monitor the price development of LUNA so as not to suffer intermittent losses greater than the rewards hit.
CONCLUSION
Becoming an LP provider can allow you to generate significant passive income. You have to take the time to understand how the platform on which you deposit your funds works to know what risks you are exposing yourself to.
You can opt for tokens whose prices move at the same time in order to protect yourself from intermittent losses.
We will see in a future article how to optimize the management of your liquidity provider positions. If you are interested in other methods of generating passive income, you can consult our articles on borrowing , staking or lending .