After successfully breaking out of $3200, Ethereum re-entered violently and began a slow and painful decline. The economic and geopolitical situation still weighs heavily on global financial markets, and cryptocurrencies being a class of risky assets (also called risk-on), they are not exempt from this general decline. Let’s discover together the important levels on this asset in this new analysis.
TECHNICAL ANALYSIS
ETHEREUM VS. USD
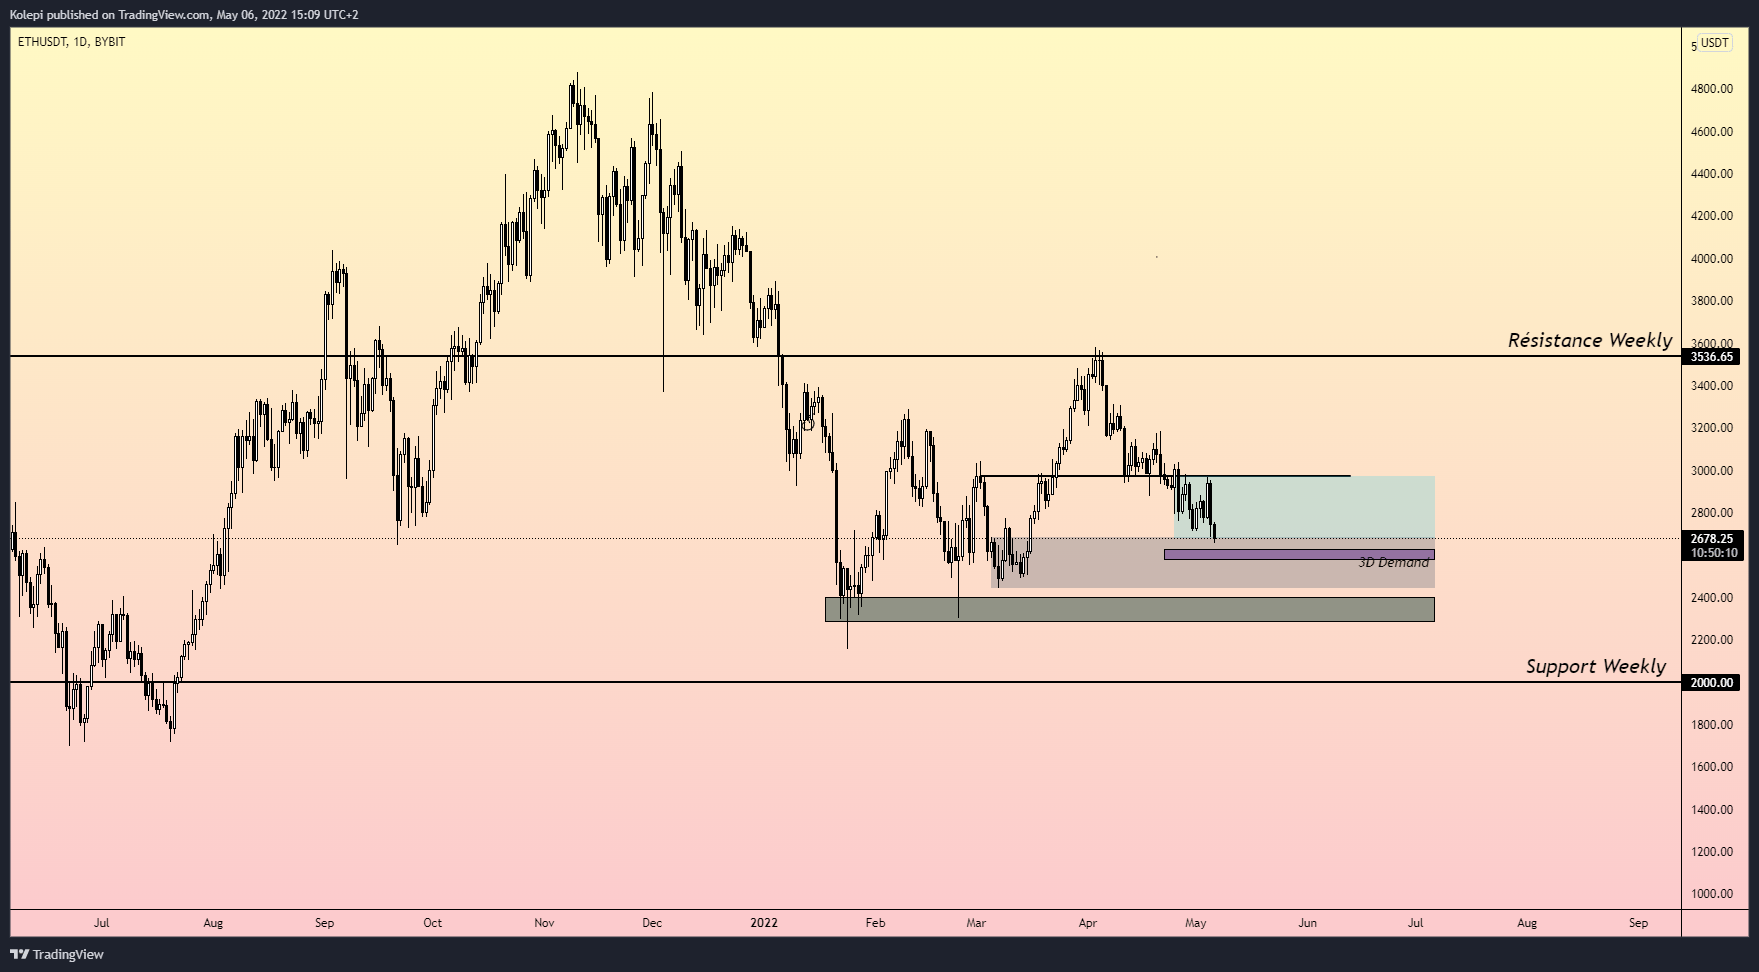
In terms of price action, it is relatively readable on Ethereum. We see the daily downtrend very clearly. The troughs and peaks are less and less high. We can confirm this with the short term moving averages. We also see the $3,000 level very clearly as a notable pivot point, having acted as resistance, but also as support on several occasions.
The $2,600 level should offer us some buying reaction due to its presence of volume (commonly referred to as an HVN, High Volume Node). We will confirm this immediately by activating my favorite indicators, namely the moving averages as well as the Volume Profile.
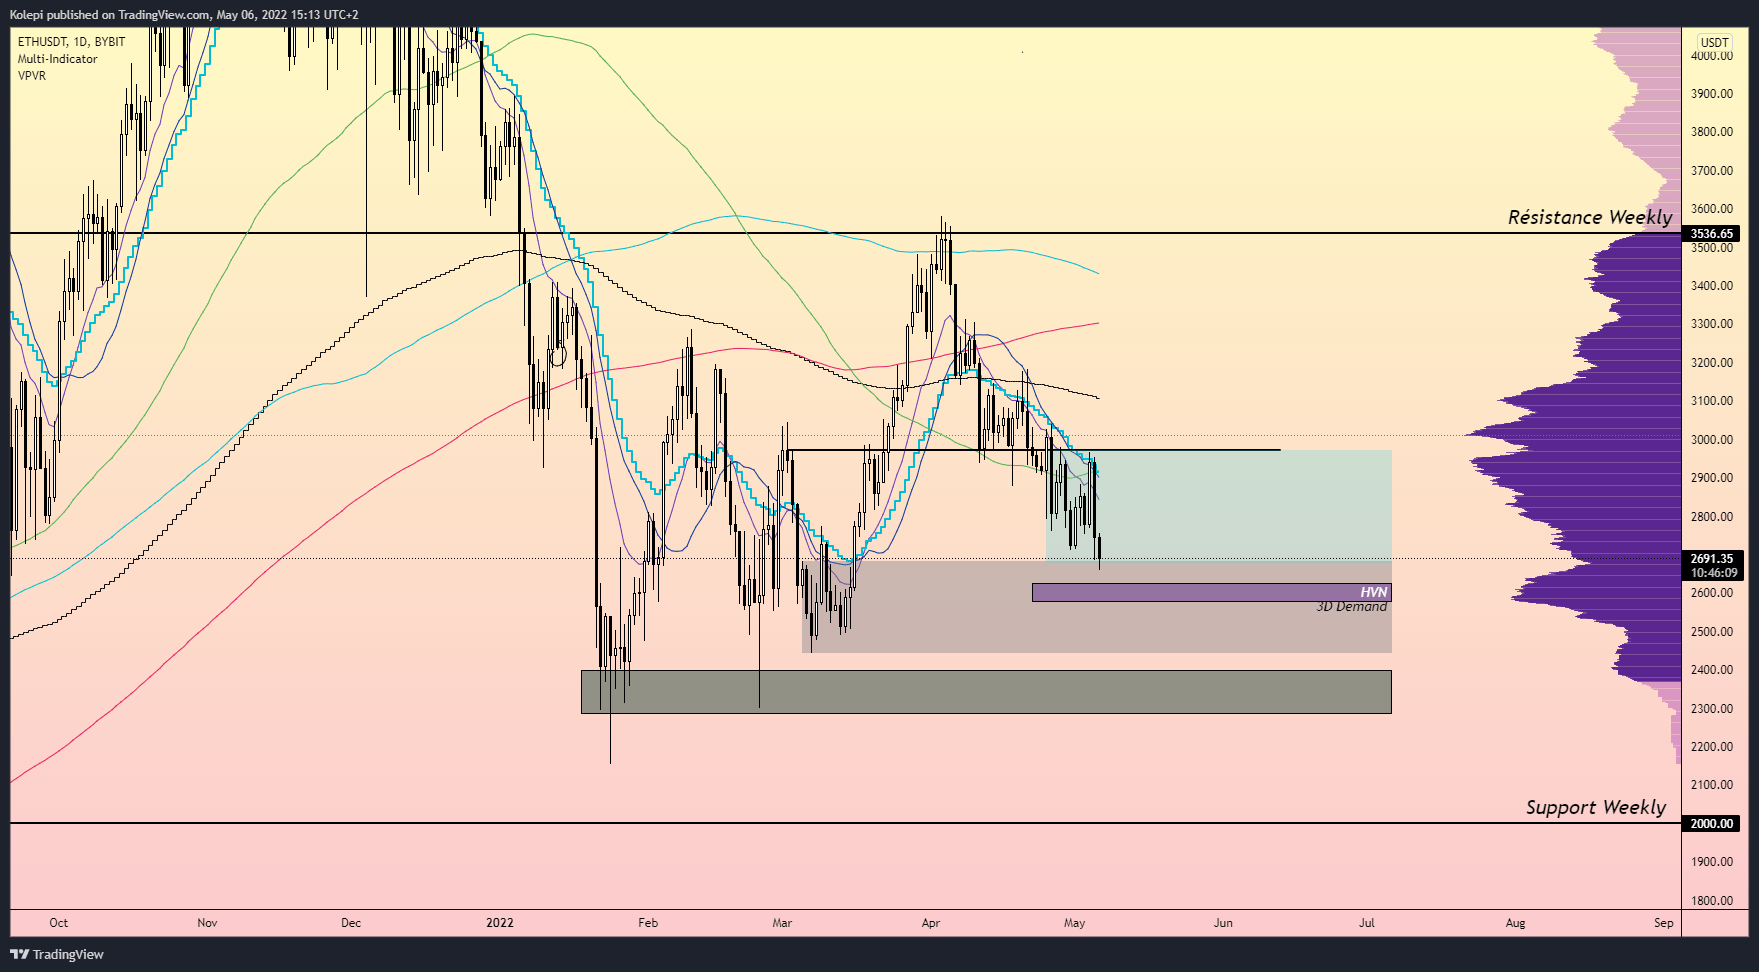
By activating the moving averages as well as the volume profile, we can confirm that the $2,600 represents an important point, a High Volume Node is there. We can therefore expect a buying reaction on this point.
Knowing that we are in a daily downtrend, you should play quick take profit on a long position. We don’t want to stay long in a long position knowing that the underlying trend is down, so place your take profit (and your stop loss) and don’t be too greedy!
The $2,400 level that we have also been working a lot does not represent a very important support level. There’s not a lot of volume on this level, and I wouldn’t go long here!
I remind you that these analyzes are intended to give you key points in the short or medium term. Thus, I think that in the longer term, the really interesting level to buy Ethereum is between $2,200 and $1,800, representing an important weekly support.
ETHEREUM VS. BITCOIN
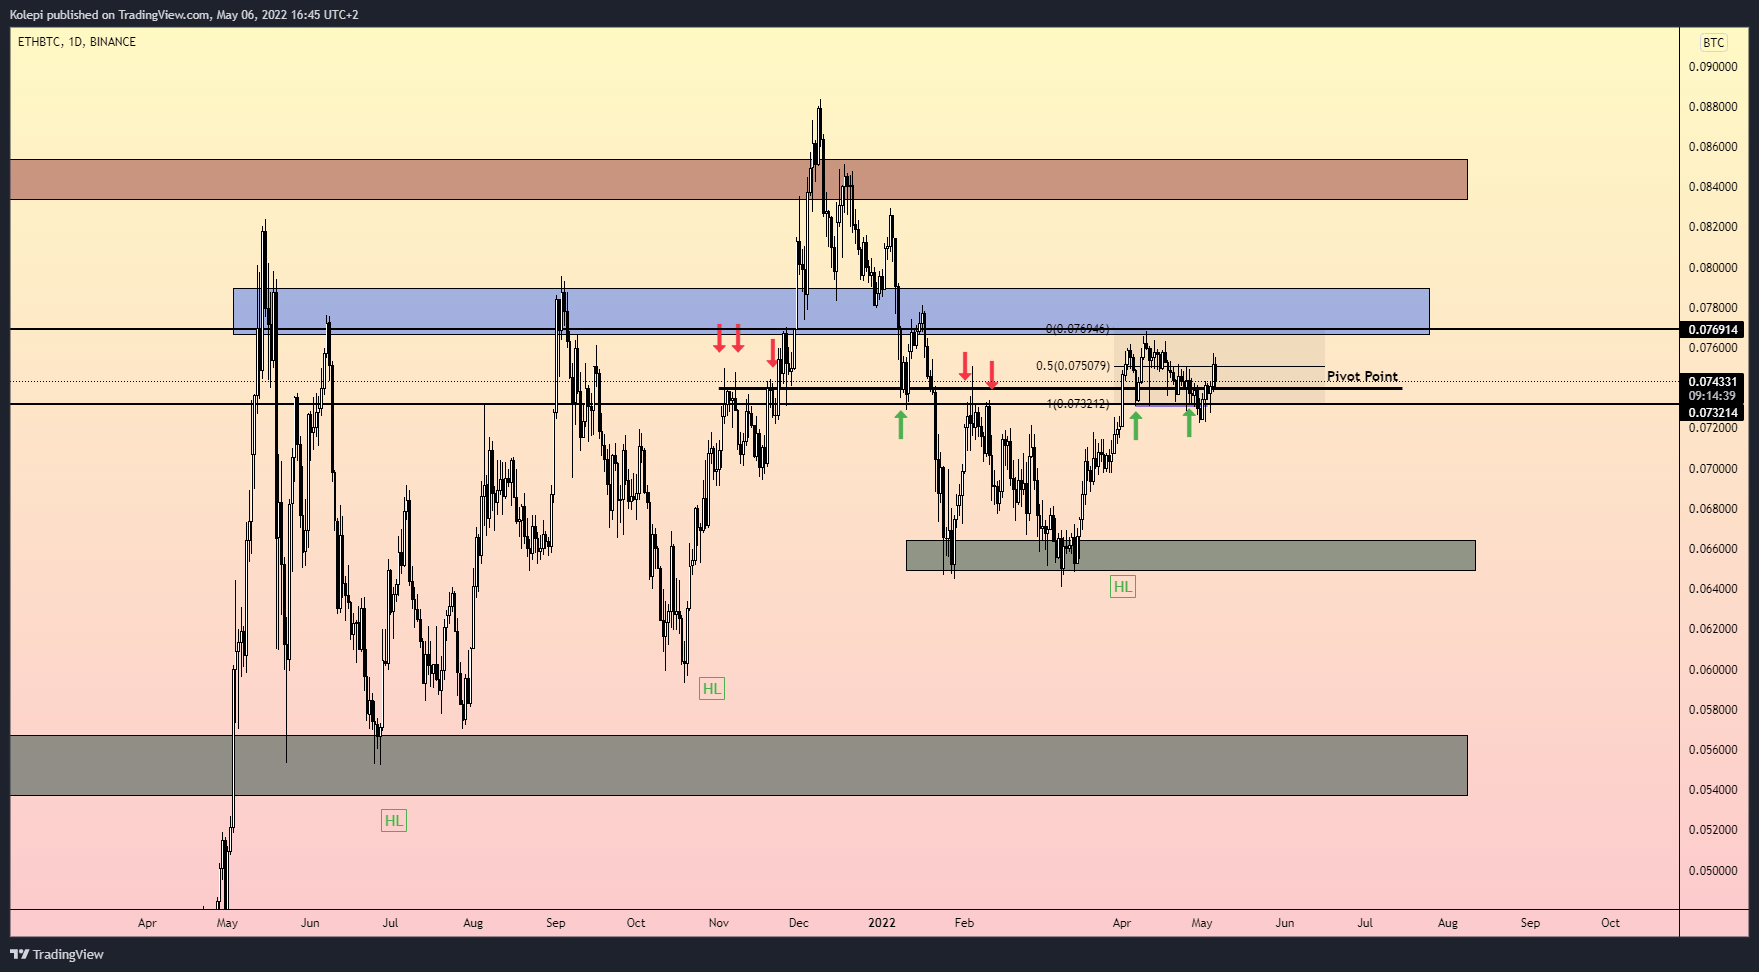
Against Bitcoin, Ethereum reacts particularly well and remains in an interesting uptrend. The asset remains in a weekly bullish trend.
We have been in a channel between 77,000 satoshis and 73,000 satoshis for several weeks. The 66,000 Satoshis are the bottom to defend in order to avoid changing the underlying trend.
It is always interesting to observe the Ethereum vs. Bitcoin ratio , as it gives a health status on Ethereum, and by extension, market alts.
FINANCIAL DATA, ORDERFLOW.
WEEKLY VOLUME PROFILE.
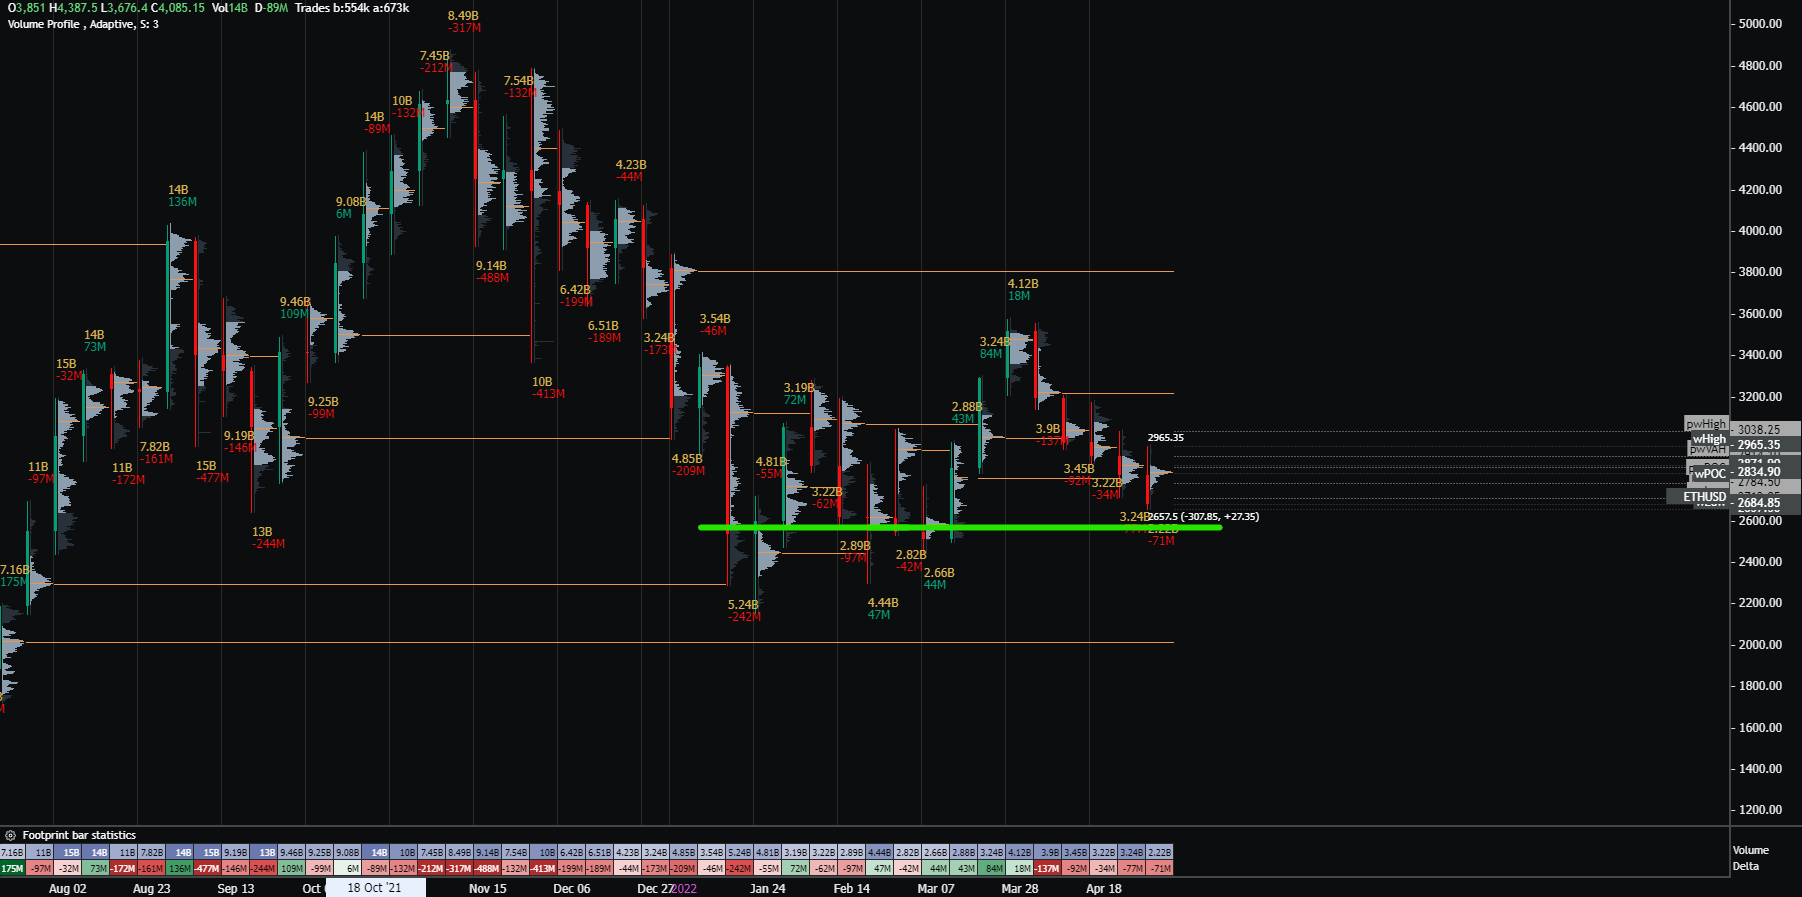
Here we see the “Volume Profile” chart of Ethereum, in 1 week. I drew a green line, which agrees well with the thought mentioned above: the $2,600 level represents a major level of volume.
This is how we can think of playing a short-term movement on this level, with a quick take profit as said above. Below, it will become our main resistance level and for the more seasoned among you: an interesting short level.
I take advantage of the fact of talking about shorting Ethereum to remind you that it is not as easy to short an asset as to be a buyer. We must already start from this premise: a short offers you a limited profit expectation for an unlimited possible loss. The Stop Loss is therefore even more important.
OPEN-INTEREST
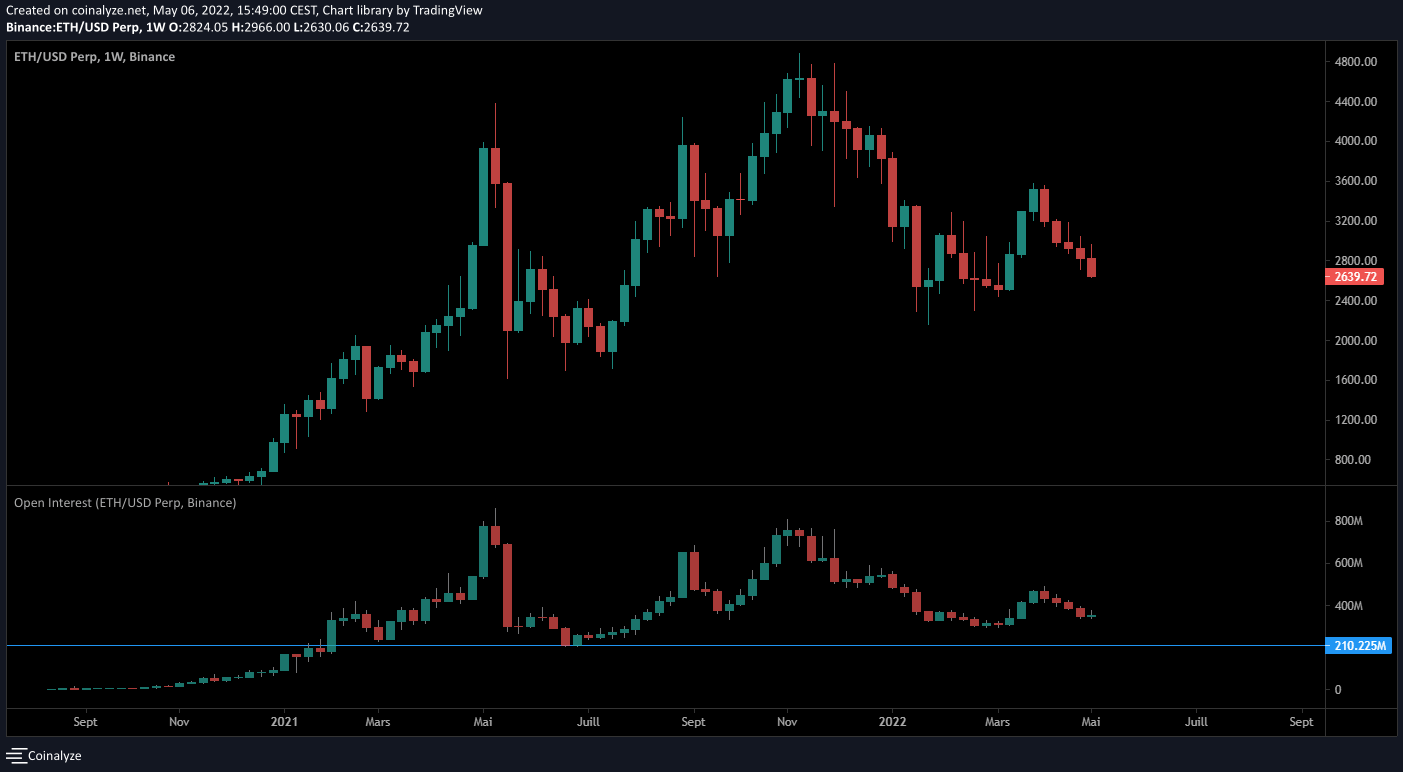
Few things to add concerning the Open Interest, which represents the amount of money injected into the perpetual markets.
These markets are often used to play short-medium term moves with leverage. We can see that the responders are now relatively calm, but still have hope. Ethereum’s last leg up, up to $3,600, was fueled a lot by Open Interest, and, by extension, short-term speculators. However, we have yet to reach the Open Interest levels of July 2021, where fear was at its peak.
OPTIONS
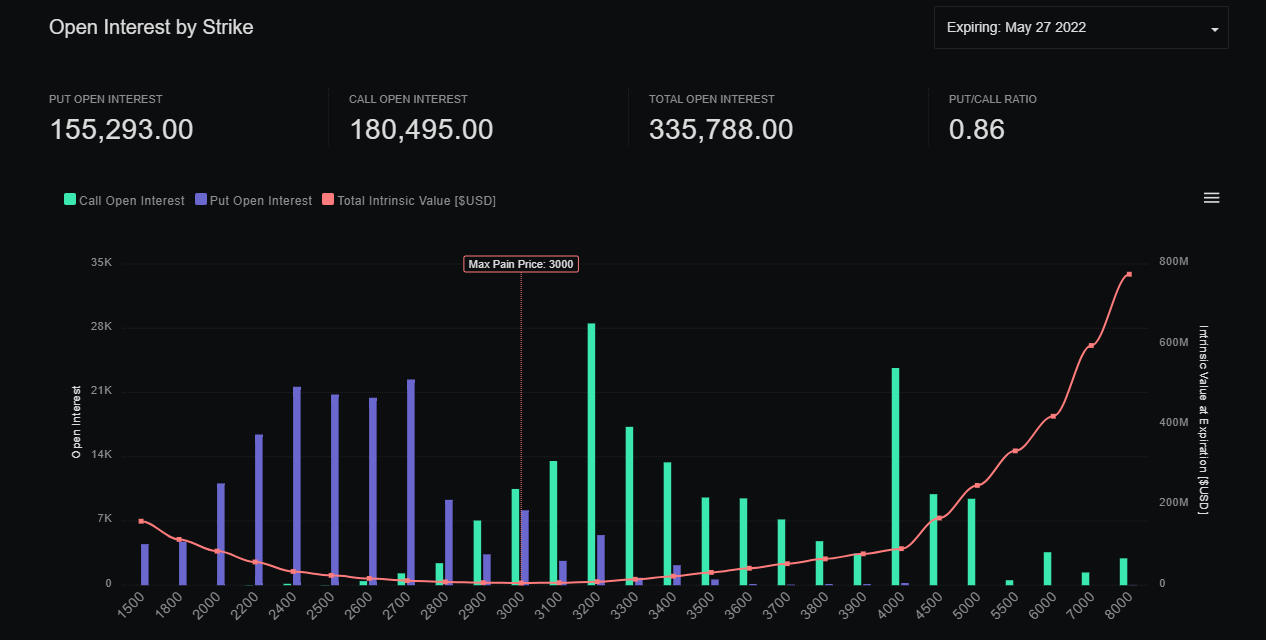
The next major option close will be on May 27, 2022, with nearly 336,000 Ethereum set to expire.
The Max Pain Price is at $3,000, which will therefore be an important step to watch in the coming weeks. This is where the most options traders will lose, and the week leading up to this expiration, the price tends to be drawn to this level.
This max bread price may change in the coming weeks.
ON-CHAIN DATA.
NET UNREALIZED PROFIT/LOSS (NUPL)
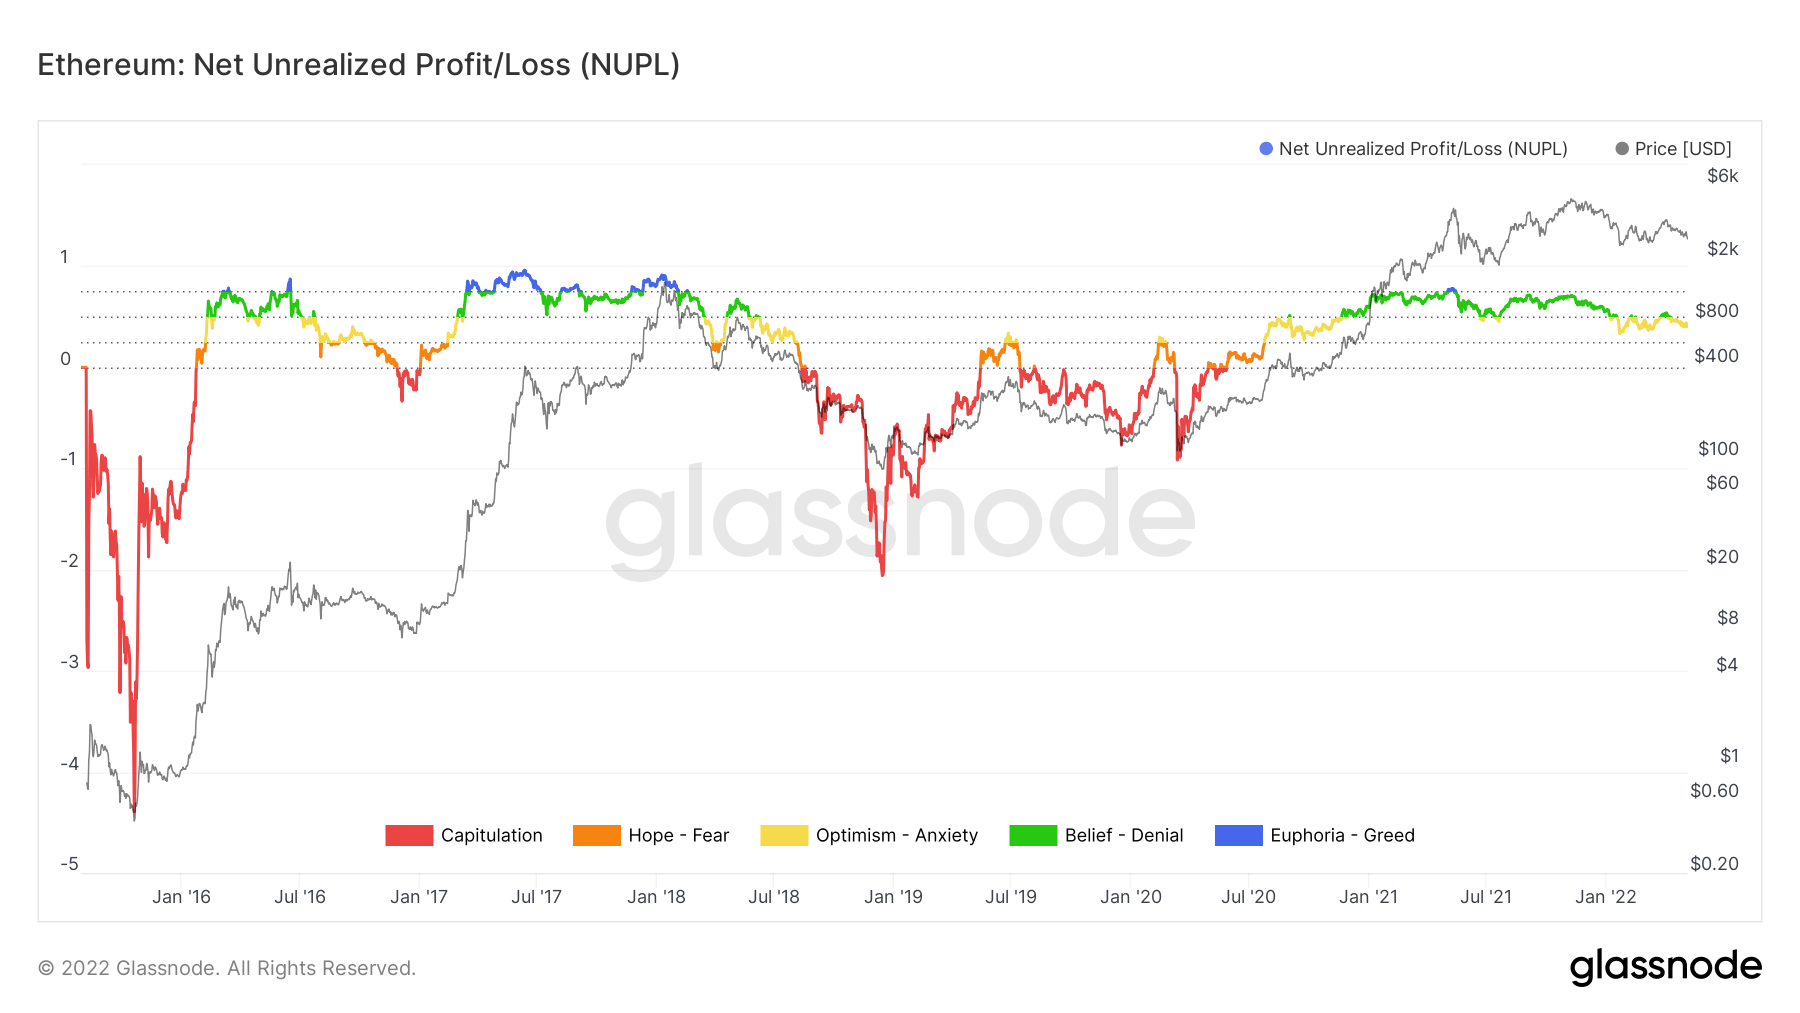
Here we see the Realized Profit and Loss chart which can be very relevant in understanding the psychology of traders. We can see that we are currently in a period of optimism and even anxiety. We are therefore still a long way from experiencing the long-awaited capitulation by long-term investors.
I take advantage of this somewhat longer-term chapter to remind you that the current periods of fear are very good for initiating a DCA and accumulating the values that have interested you for several months or even years.
ETHEREUM 2.0 STAKING
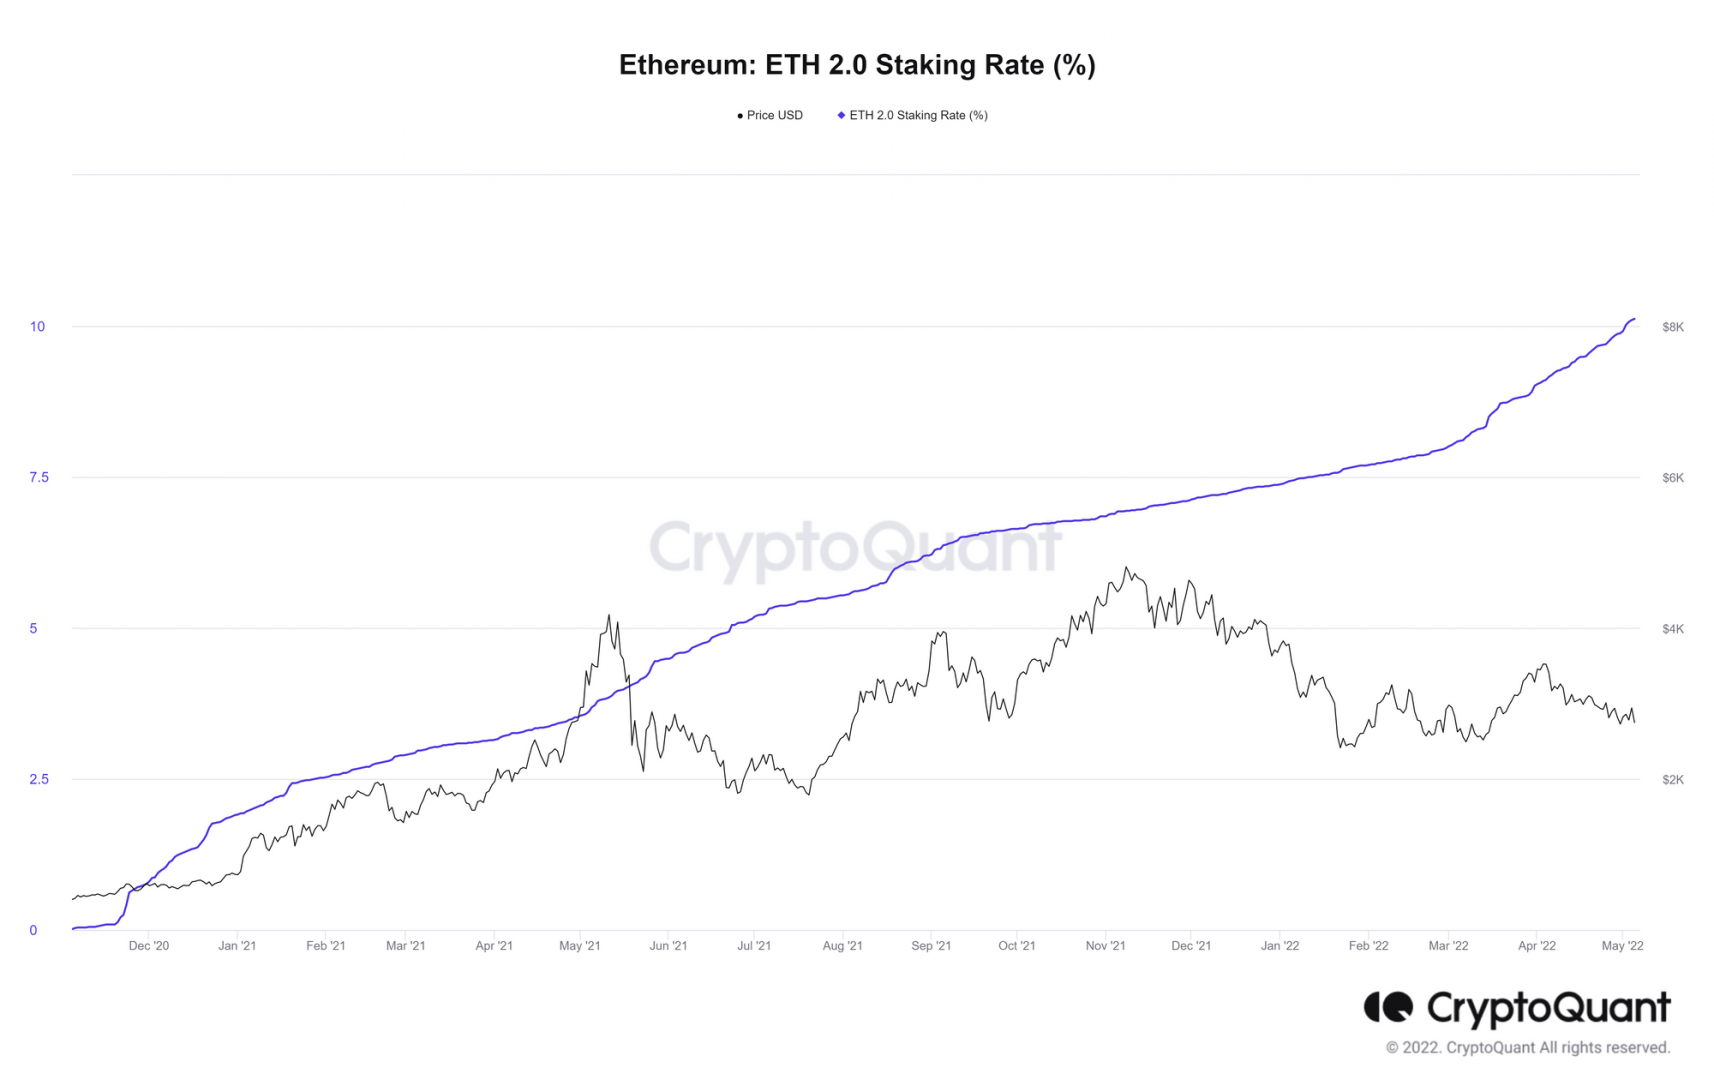
We are here on news to remind us that Ethereum remains very bullish in the long run: 10% of Ethereum supply is currently locked for the long-awaited update to Ethereum 2.0. This news suggests that long-term investors remain present and continue to follow the project closely.
EXCHANGE RESERVE
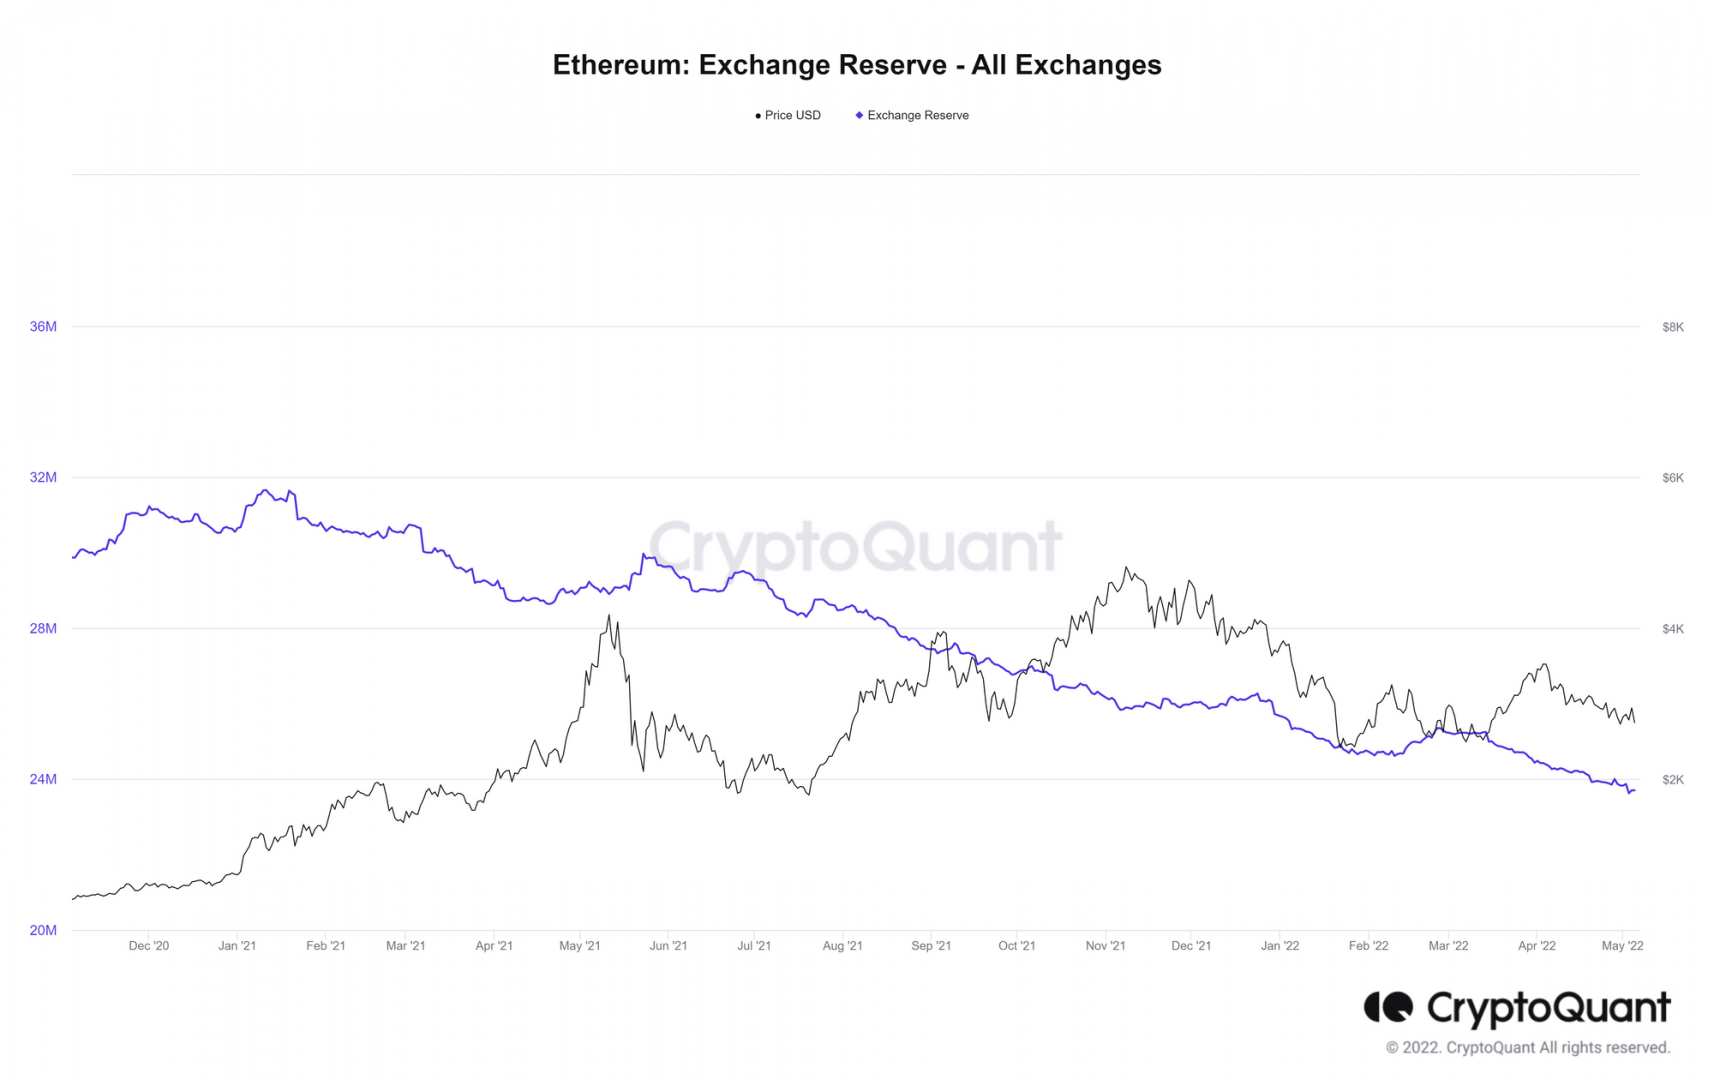
The market is only a game of supply and demand, if we think very pragmatically. With this in mind, I find it interesting to look at the reserve of the exchanges, which are constantly being depleted. Thus, we can see that the supply is increasingly reduced, which is also a bullish fact in the long term.
EXCHANGE NET POSITION CHANGE
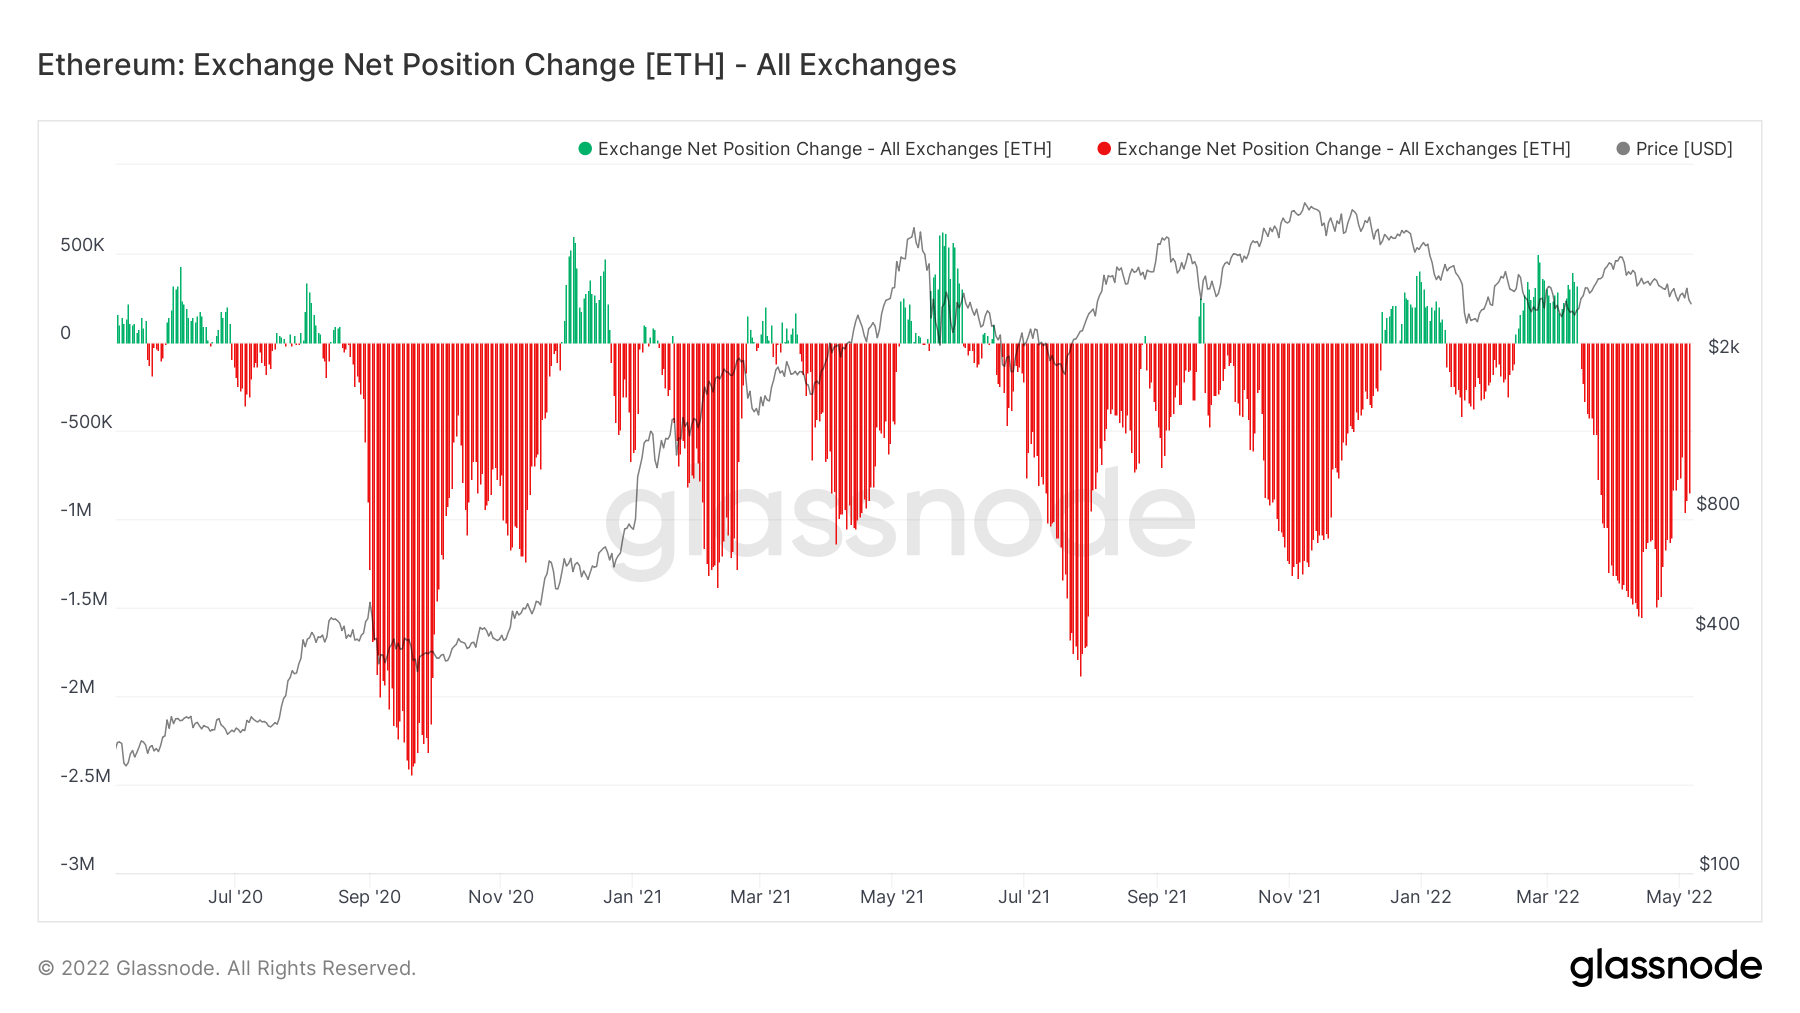
To conclude, this graph shows Ethereum entering and leaving the exchanges. Thus, we can see that the trend has been accumulating for 2 years now. We have not reached highs like in September 2020. However, there is no reason to be bearish about the long-term future of Ethereum. These graphs prove it to us, many operators accumulate Ether for the future, and by extension reduce the supply in circulation by keeping them in their portfolio.
KEY LEVELS
$3,000: Pivot point and volume node. It should serve as resistance.
$2,600: Large volume node in the demand zone. It should serve as a support.
$2,400: Last support, visible by price and not by volume. Observed by many, but not necessarily an interesting place to buy.
$2,000: Weekly support.
Ethereum is subject, like any “risk-on” asset, to economic and geopolitical hazards . The on-chain charts prove it to us: Ethereum is bullish in the long and very long term. Still, in the coming weeks or even the next few months, Ethereum should continue to suffer from the end of “magic money” and the increase in rates.
If you are a long-term investor, the time has come for DCA but I am not telling you anything. It may be interesting to strengthen this DCA from $2,200.
If you are a speculator, you have to take quick profits in an uncertain and above all very difficult market.