The price of Bitcoin (BTC) continues its trend reversal and comes up against the next big resistance: the 200-period moving average. The influx of new entities joining the network, coupled with the observation of growing on-chain activity indicates an encouraging renewed interest and engagement. On-chain analysis of the situation.
The Bitcoin network is regaining strength
The price of Bitcoin (BTC) continues its trend reversal and comes up against the 200-period moving average. A true indicator of the long-term directional bias of the market, the MA200 constitutes, with the realized price of STH, the next major resistance that BTC must overcome in order to confirm a resumption of the rise.
Approaching a defining pivot point, bitcoin seems to be once again attracting the attention of a large number of participants who are leaving signs of their activity and growing engagement on the chain.
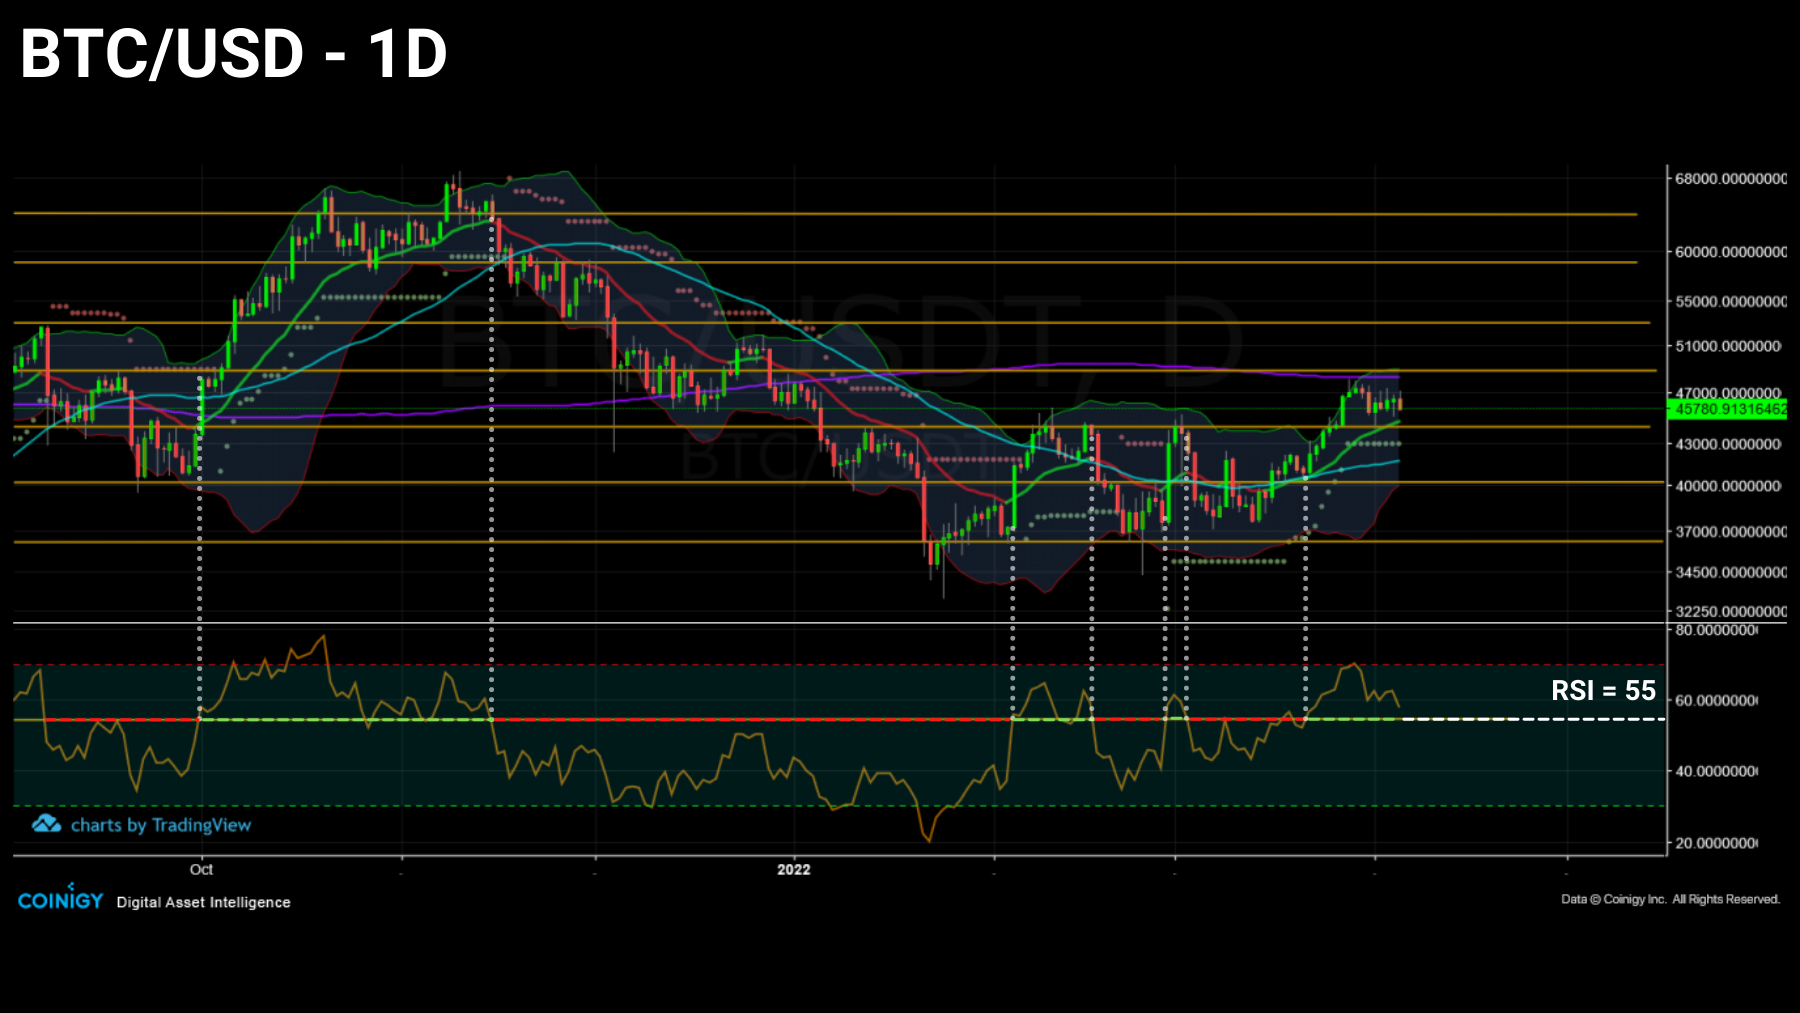
Figure 1: Daily price of bitcoin (BTC)
This week, in order to gauge the market’s ability to enter a new bullish phase, we will focus on:
- the growth of on-chain entities , in order to quantify the arrival of new market entrants;
- to demand block space , for the purpose of determining the intensity of participants’ economic activity;
- the short, medium and long term momentum of the market , to determine the directional bias of the price of BTC.
Entities are flocking back to the network
Before getting to the heart of the matter, let’s quickly mention that the price of BTC is currently very close to the cost base of short-term investors (STH) , around $47,000.
This indicator having historically served as short-term support (blue) or resistance (purple) for the price of bitcoin, it represents one of the most decisive price levels currently.
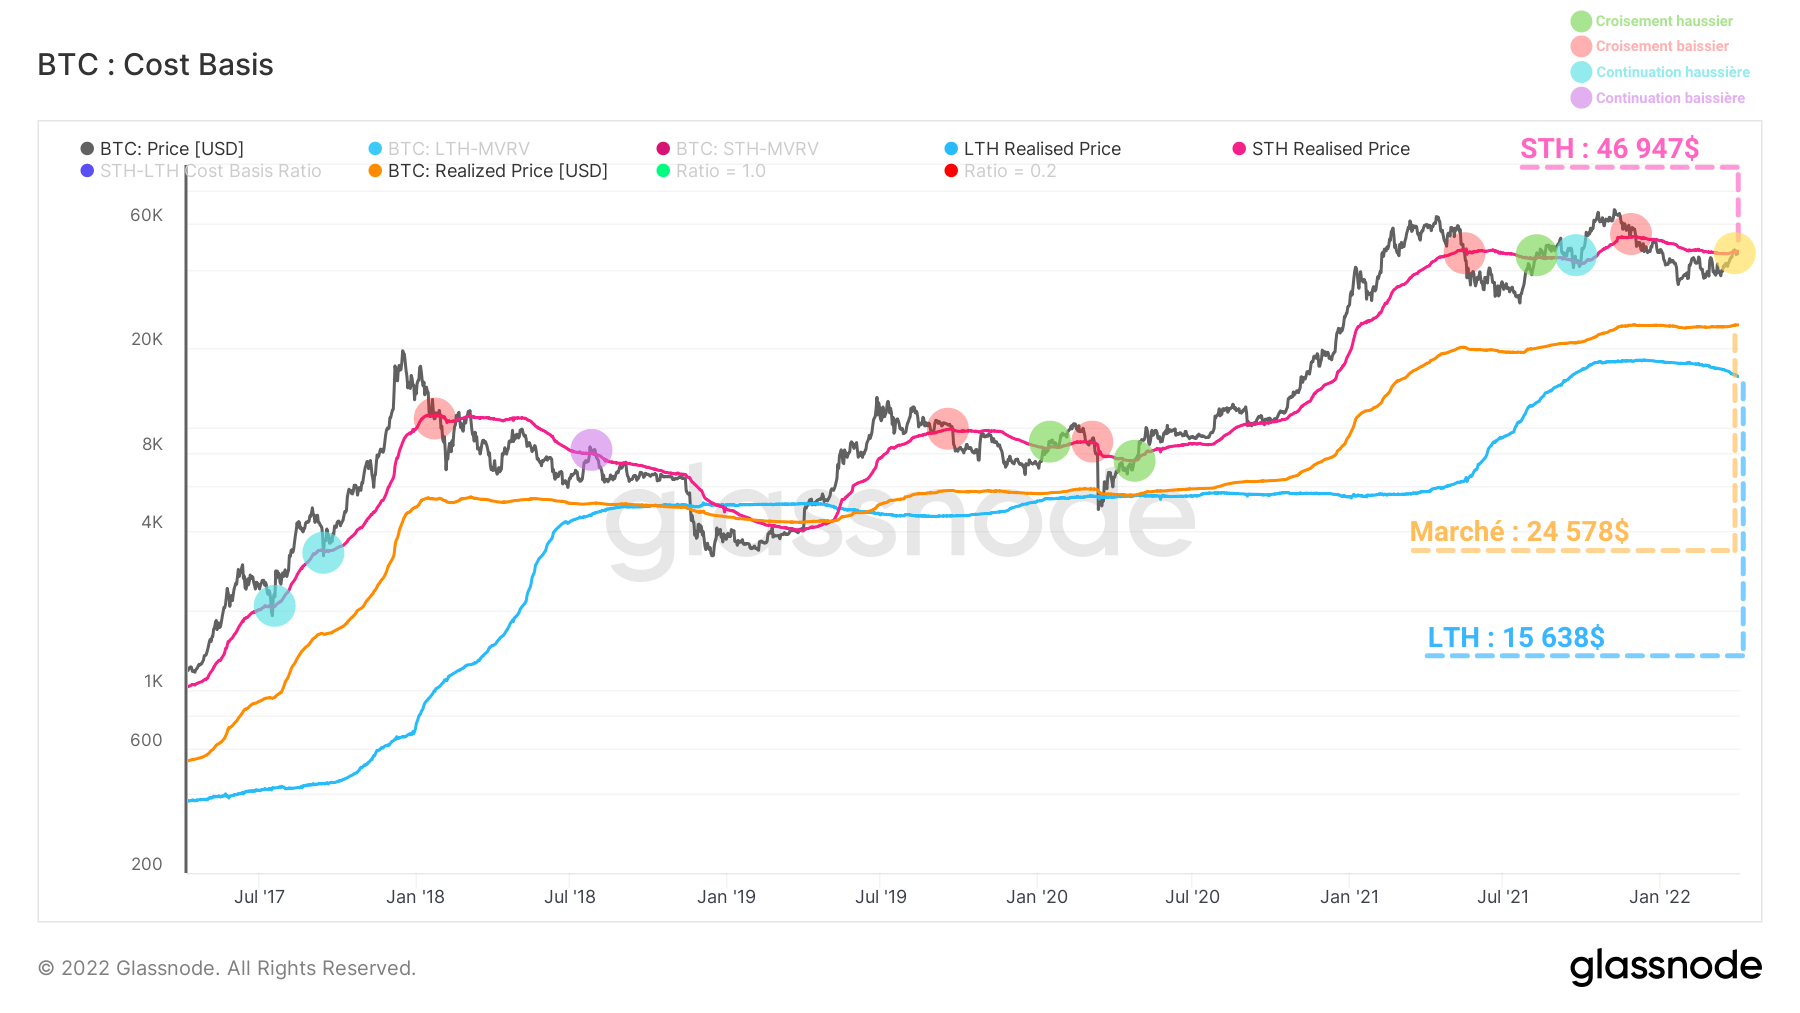
Figure 2: Base market, STH and LTH costs
Once the base cost of STHs has been crossed, the market acquires a profitability structure that is often conducive to the appearance of powerful uptrends.
Indeed, as soon as a majority of short-term investors find themselves in a state of profit, the overall selling pressure of the STH cohort decreases drastically, limiting the resistance to the rise in price.
This level, however, being only tested at the time of writing these lines, it is preferable to wait a few more weeks to confirm or deny that a new trend is indeed triggered in the long term.
However, there is plenty of data pointing to a reversal in market structure . This is the case for metrics related to the growth and activity of on-chain entities.
💡 By applying a combination of heuristics, clustering algorithms, and methods on raw string data, Glassnode provides a more accurate estimate of the actual number of users in the Bitcoin network. An on-chain entity is thus defined as one or more unique Bitcoin addresses, controlled by the same entity, be it an individual, an institution, an exchange or a company.
One of the methods used to identify the transitions of the market between its bearish and bullish phases is therefore the study of the growth of the entities present on the network.
The chart below tracks the daily number of new entities arriving on the Bitcoin network for the first time.
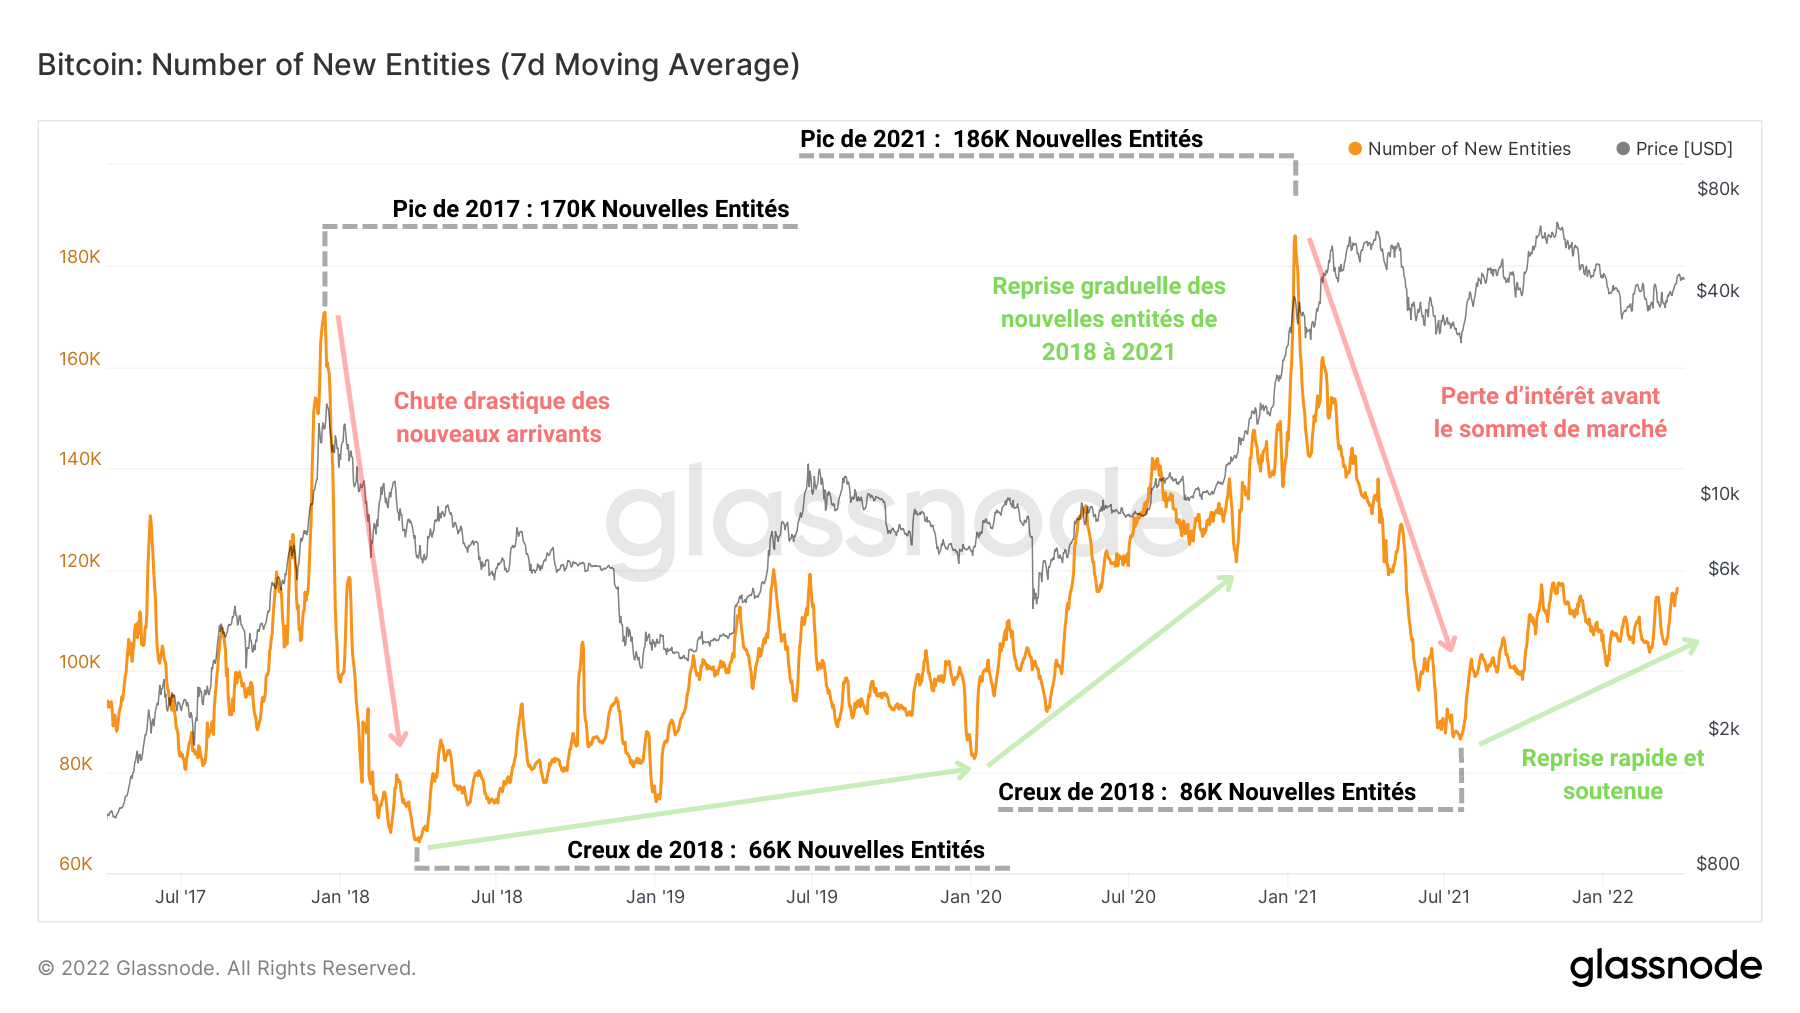
Figure 3: New Entities
While the ends of bull markets are typically marked by episodes of drastic drops in the number of new entities (late 2017 and early 2021), the market’s transition into the bull phase is more gradual.
As observed during the last major bear market (2018 – 2020), the number of new entities joining the market gradually grows as the market recovers before entering a parabolic trajectory at the beginning of the final bullish impulse.
It is also timely to note that, unlike the market top of 2017, the peak of new entities printed in January 2021 formed before the market top , signaling a non-negligible loss of interest three months before the correction. .
In addition, since the third quarter of 2021, we can observe a sustained recovery in the arrival of new participants, indicating a resurgence of interest similar to that of the second quarter of 2018.
Inseparable from the metric proposed above, the net growth of on-chain entities is defined as the difference between new entities and “disappeared” entities (entities with a zero balance that had a non-zero balance at the previous timestamp) and provides a relevant signal of investor interest in bitcoin.
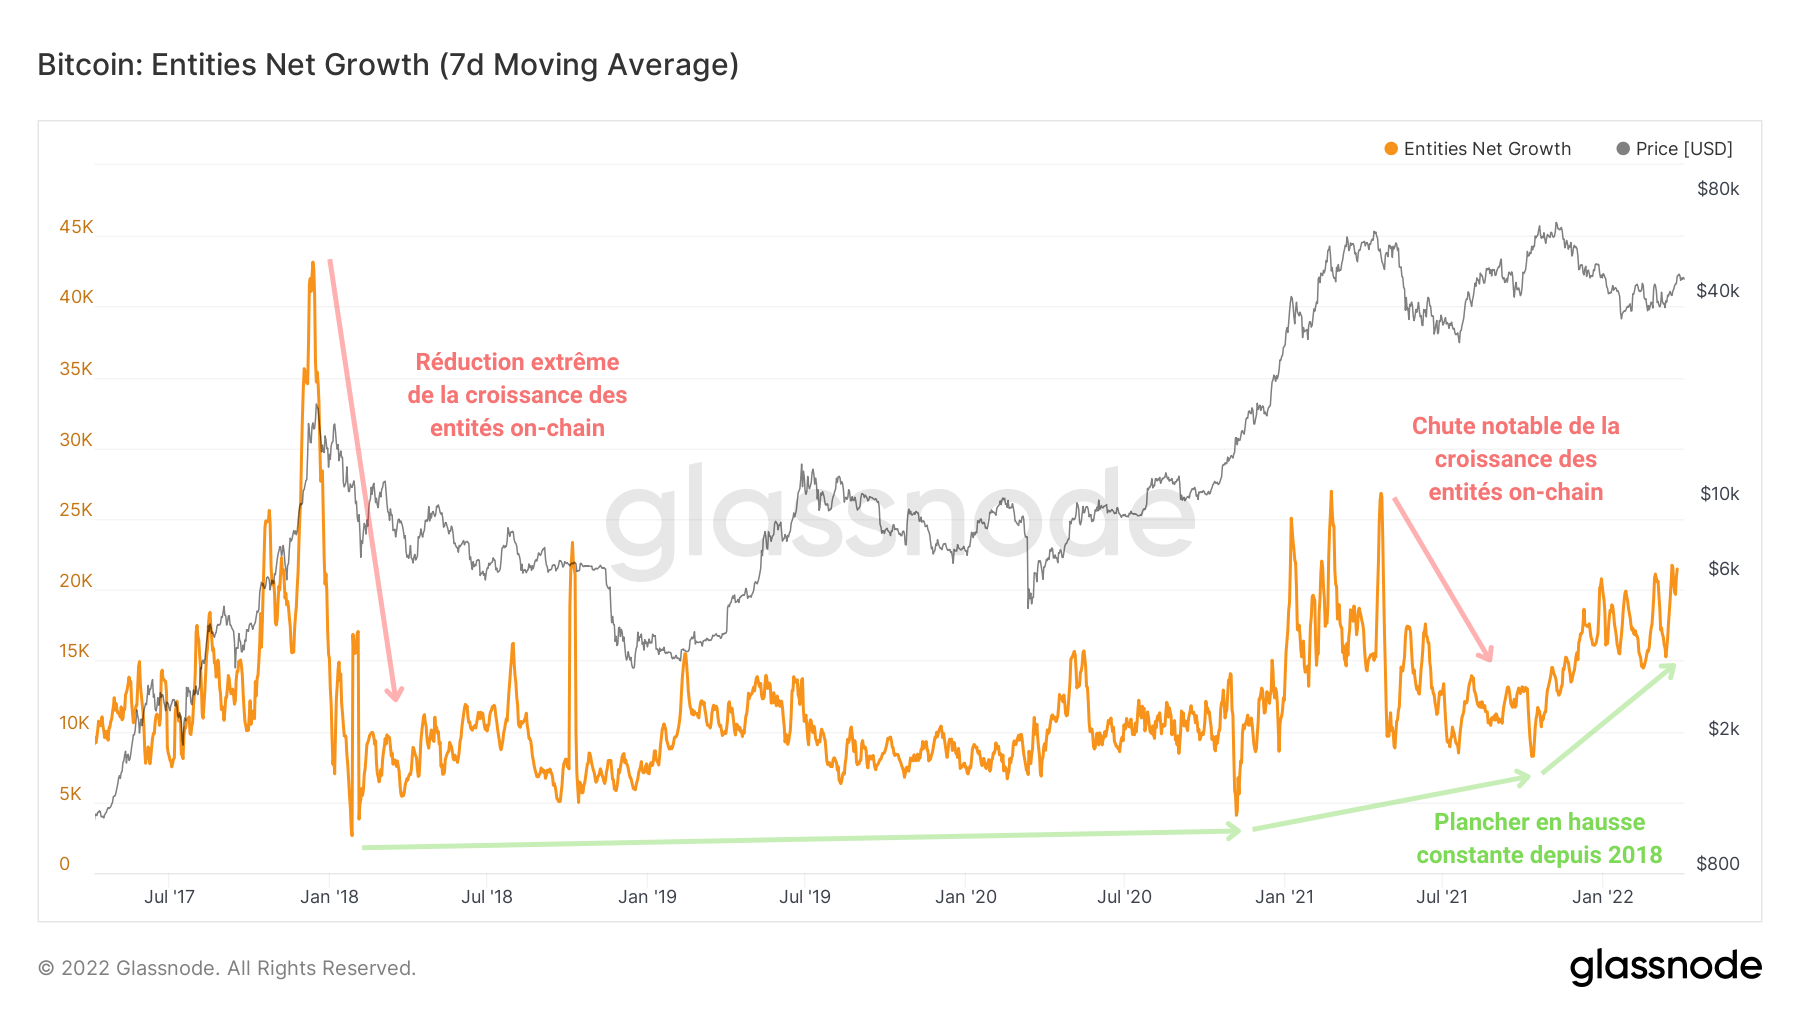
Figure 4: Net Growth of Entities
It appears on the graph above that, despite several notable reductions in the arrival of new participants, the bottom of this indicator has been rising continuously since 2018 .
In a sign of the interest in BTC, net entity growth is currently at 21,800 new daily entities . In other words: as many entities are joining the market today as during the final hike in January 2021.
Such an influx of entities following two major corrections indicates strong conviction among investors , who view BTC as an investment-worthy asset despite the current macroeconomic and geopolitical tensions.
Moreover, the count of the number of unique entities being active as a sender or receiver follows a similar dynamic to that of the number of new entities.
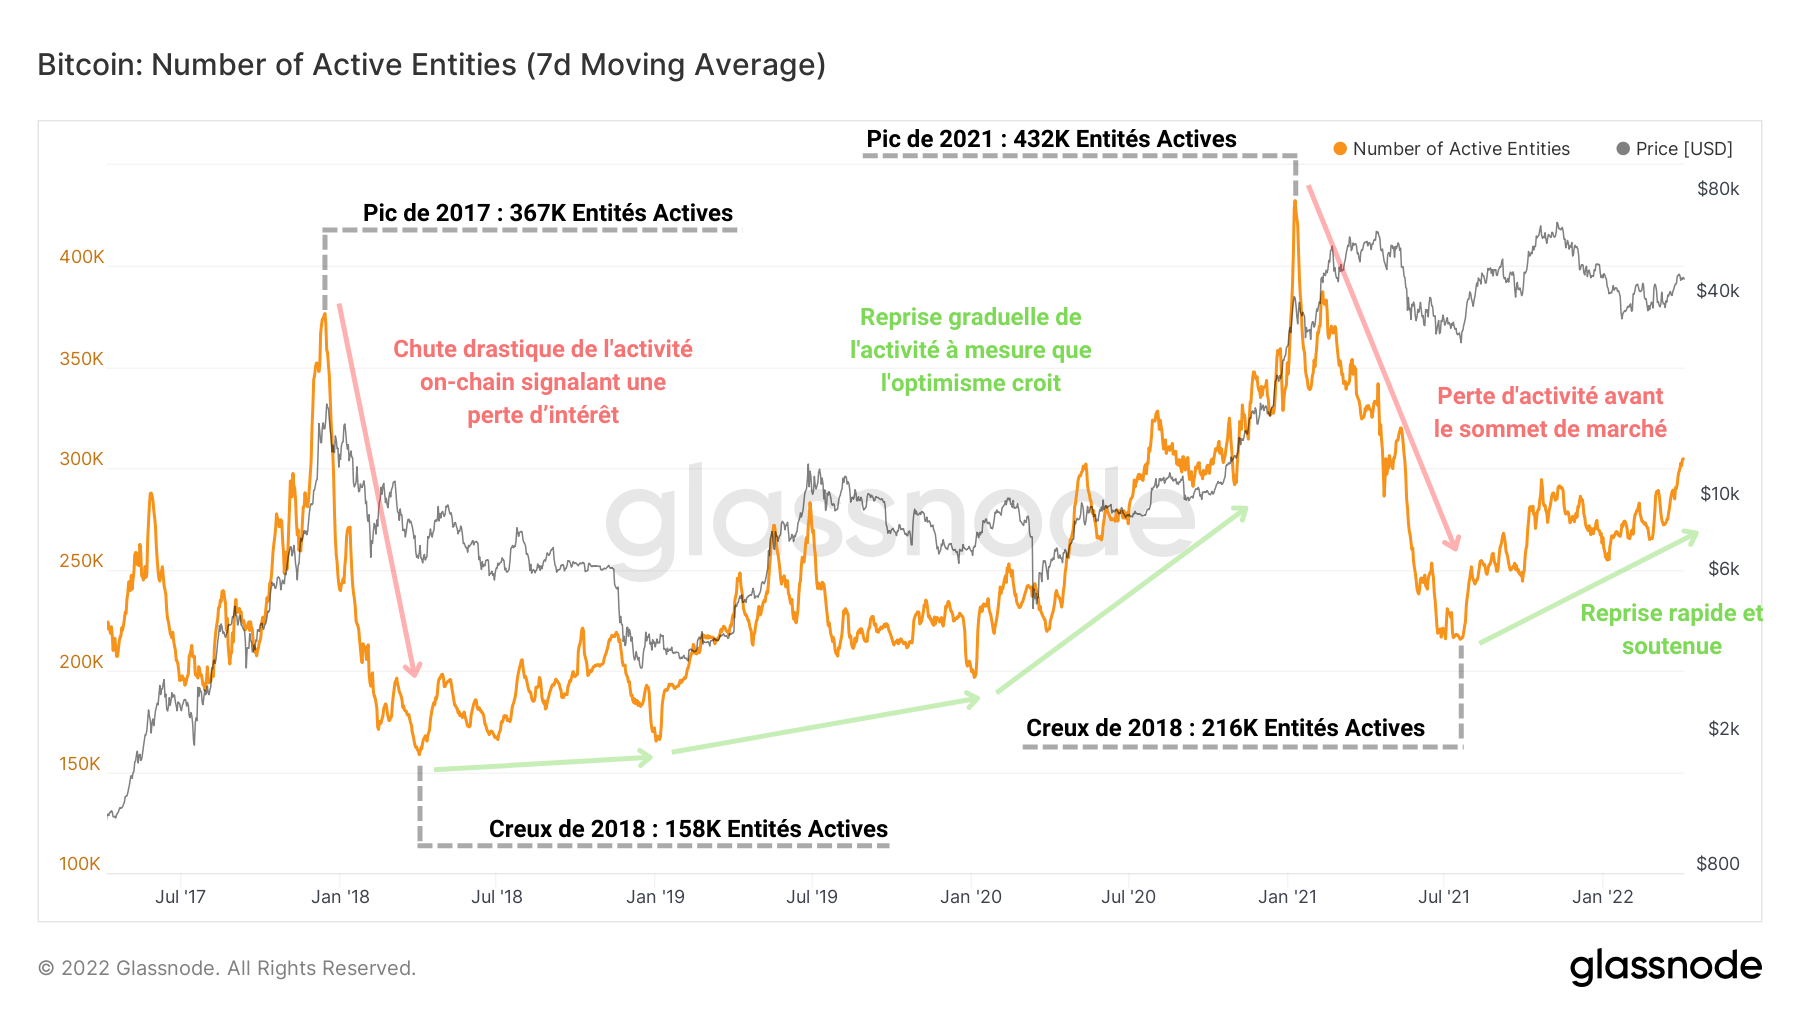
Figure 5: Active Entities
Currently counting nearly 312,000 active entities , the Bitcoin network seems to be entering a new phase of sustained economic activity, a necessary condition for triggering a new bull phase.
In fact, many entities are currently hopping and joining the market with the aim of exposing themselves to the upcoming upside potential for bitcoin (BTC).
On-chain activity resumes a bullish pace
Let us take a closer look at the activity of these entities in order to describe the transition of the market from a corrective regime to an appreciative regime.
Indeed, on-chain activity , a proxy for block space demand, is one of the parameters for gauging the economic commitment of market participants over time.
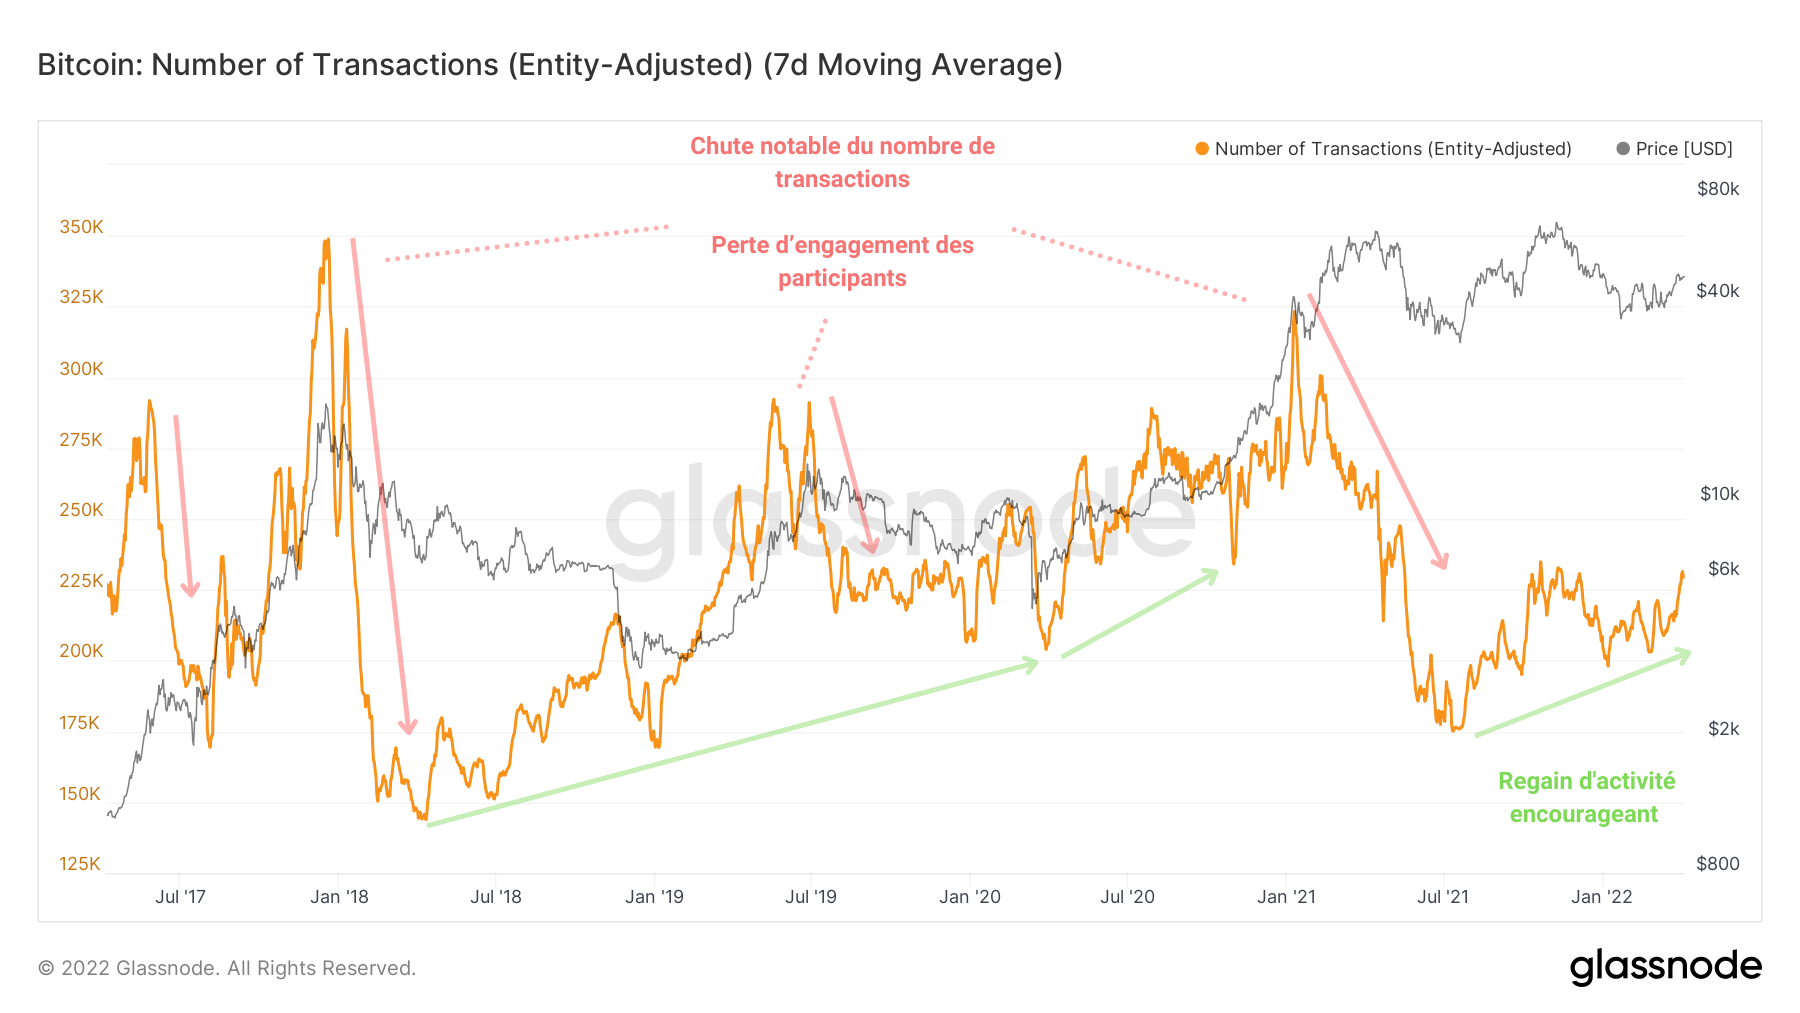
Figure 6: Number of Transactions
Illustrating the periods of high and low activity, the count of the number of transactions carried out on the network since June 2021 indicates an encouraging recovery, a sign that the price levels generated by the May capitulation caused some participants to invest more in the bitcoin.
Repeating the dynamic of entity activity discussed above, bull market spikes give rise to large drops in the number of transactions , cushioned by a gradual upsurge in on-chain activity.
Dividing BTC’s market cap by the 90-day average of daily transaction counts, the NVT Signal offers an estimate of the Bitcoin network’s valuation through the lens of its activity.
Breaking out of the base formed since the capitulation in May, this oscillator has been evaluating the value of the network on the rise for a month now. Reflecting the general upturn in activity among market participants , this indicator is used by many investors to determine their positioning and could induce positive buying pressure on the price of BTC.
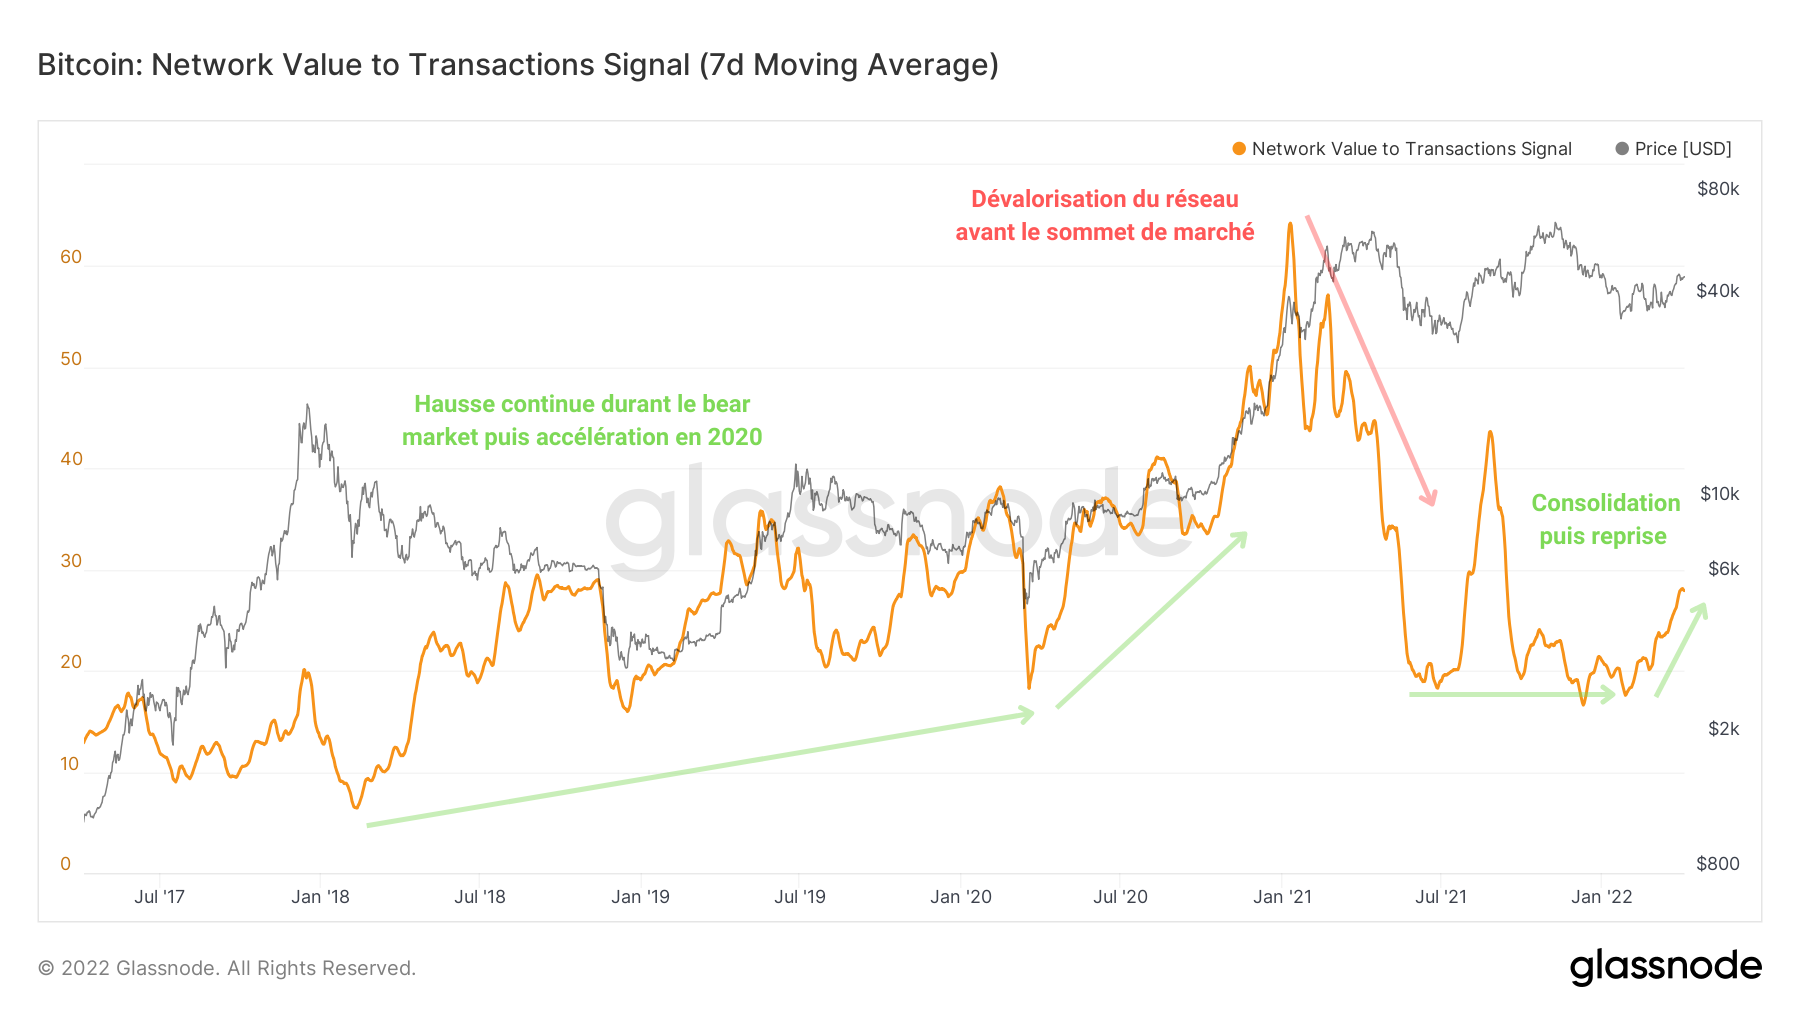
Figure 7: NVT Signal
However, the situation is not as glorious with regard to the volume of transfers circulating daily on the chain.
The graph below shows three estimates of the transfer volume value , from lightest to darkest:
- gross transfer volume, as first measured;
- exchange-adjusted transfer volume;
- the adjusted transfer volume by entities.
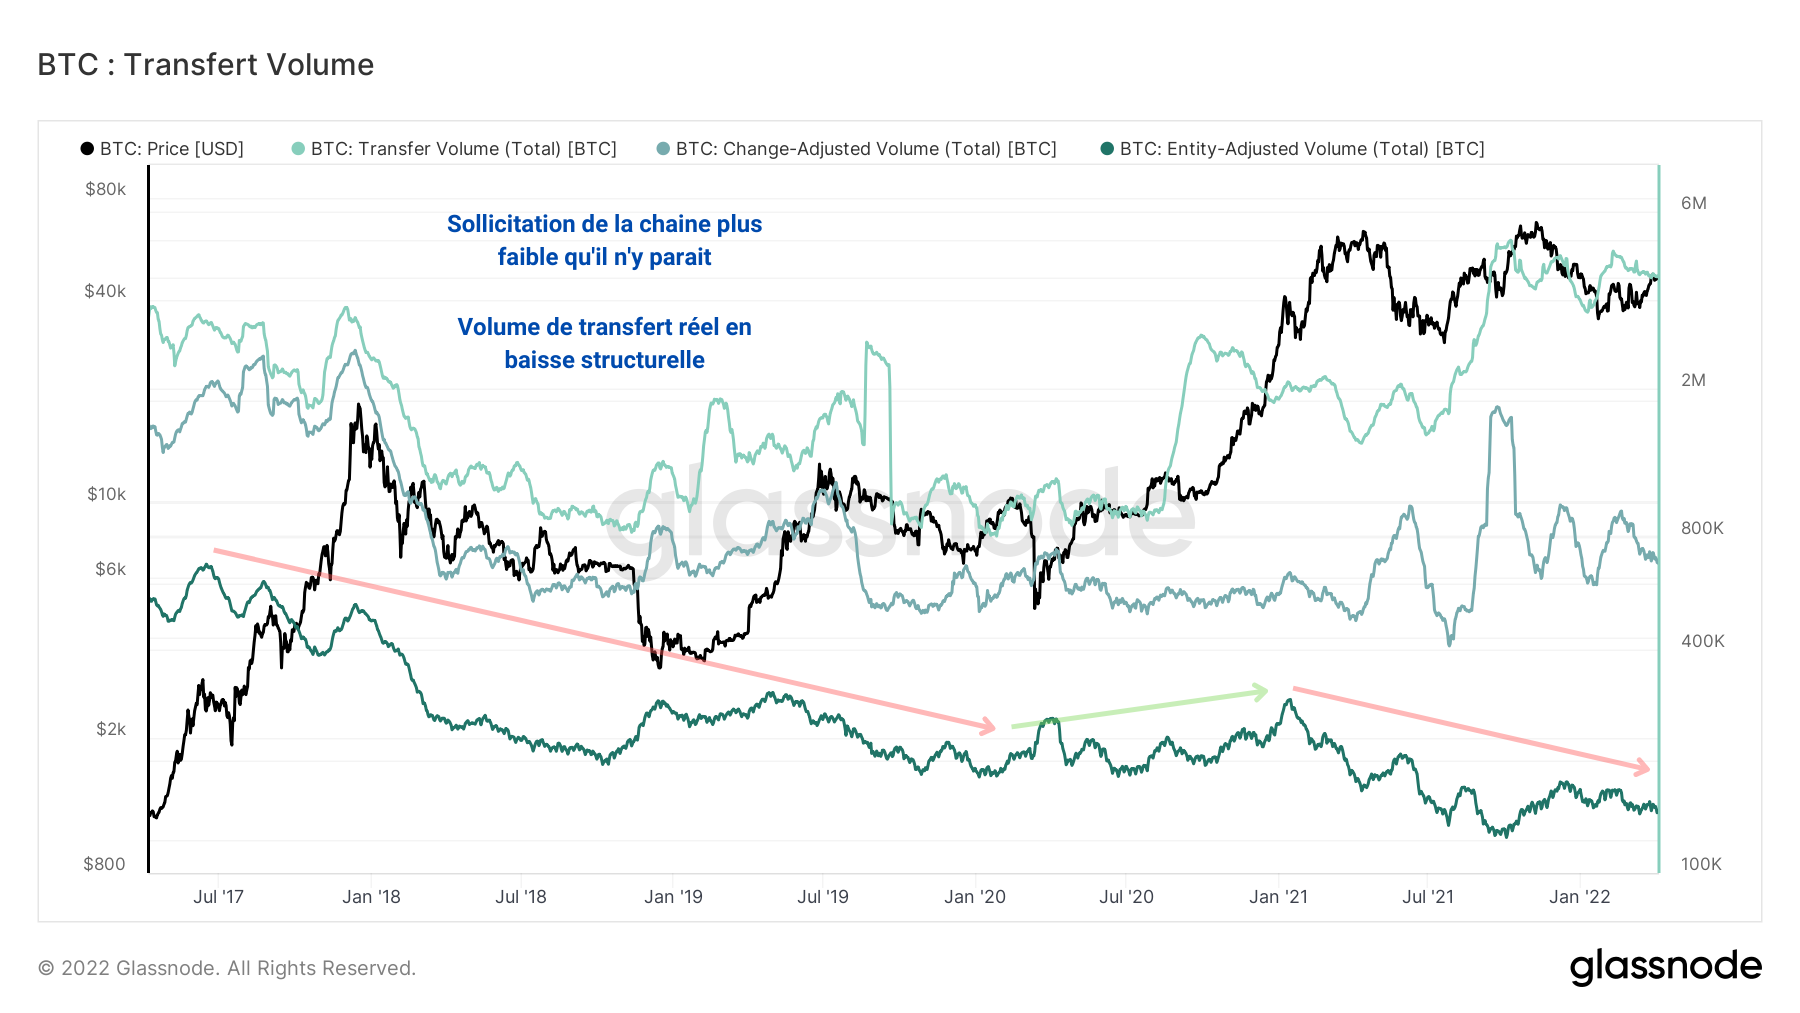
Figure 8: Gross Transfer Volume, Adjusted by Currency and Adjusted by Entities
It appears that, if the first two estimates of the transfer volume show an increase since June 2020, the second variant (adjusted by entities) allows us to affirm that the chain is in fact less in demand than it seems .
Indeed, inter-entity transfers as well as exchange returns from partially spent UTXOs distort measures of economic activity, often by overvaluing them.
It does appear that the organic transfer volume of the market is in structural decline, a sign that the total funds transferred on the chain continue to fall.
However, despite this not very encouraging observation, another metric allows us to put things into perspective. Presenting the 90-day average of the relative percentage of transfer volume in profit, the following graph informs us of a meaningful reality.
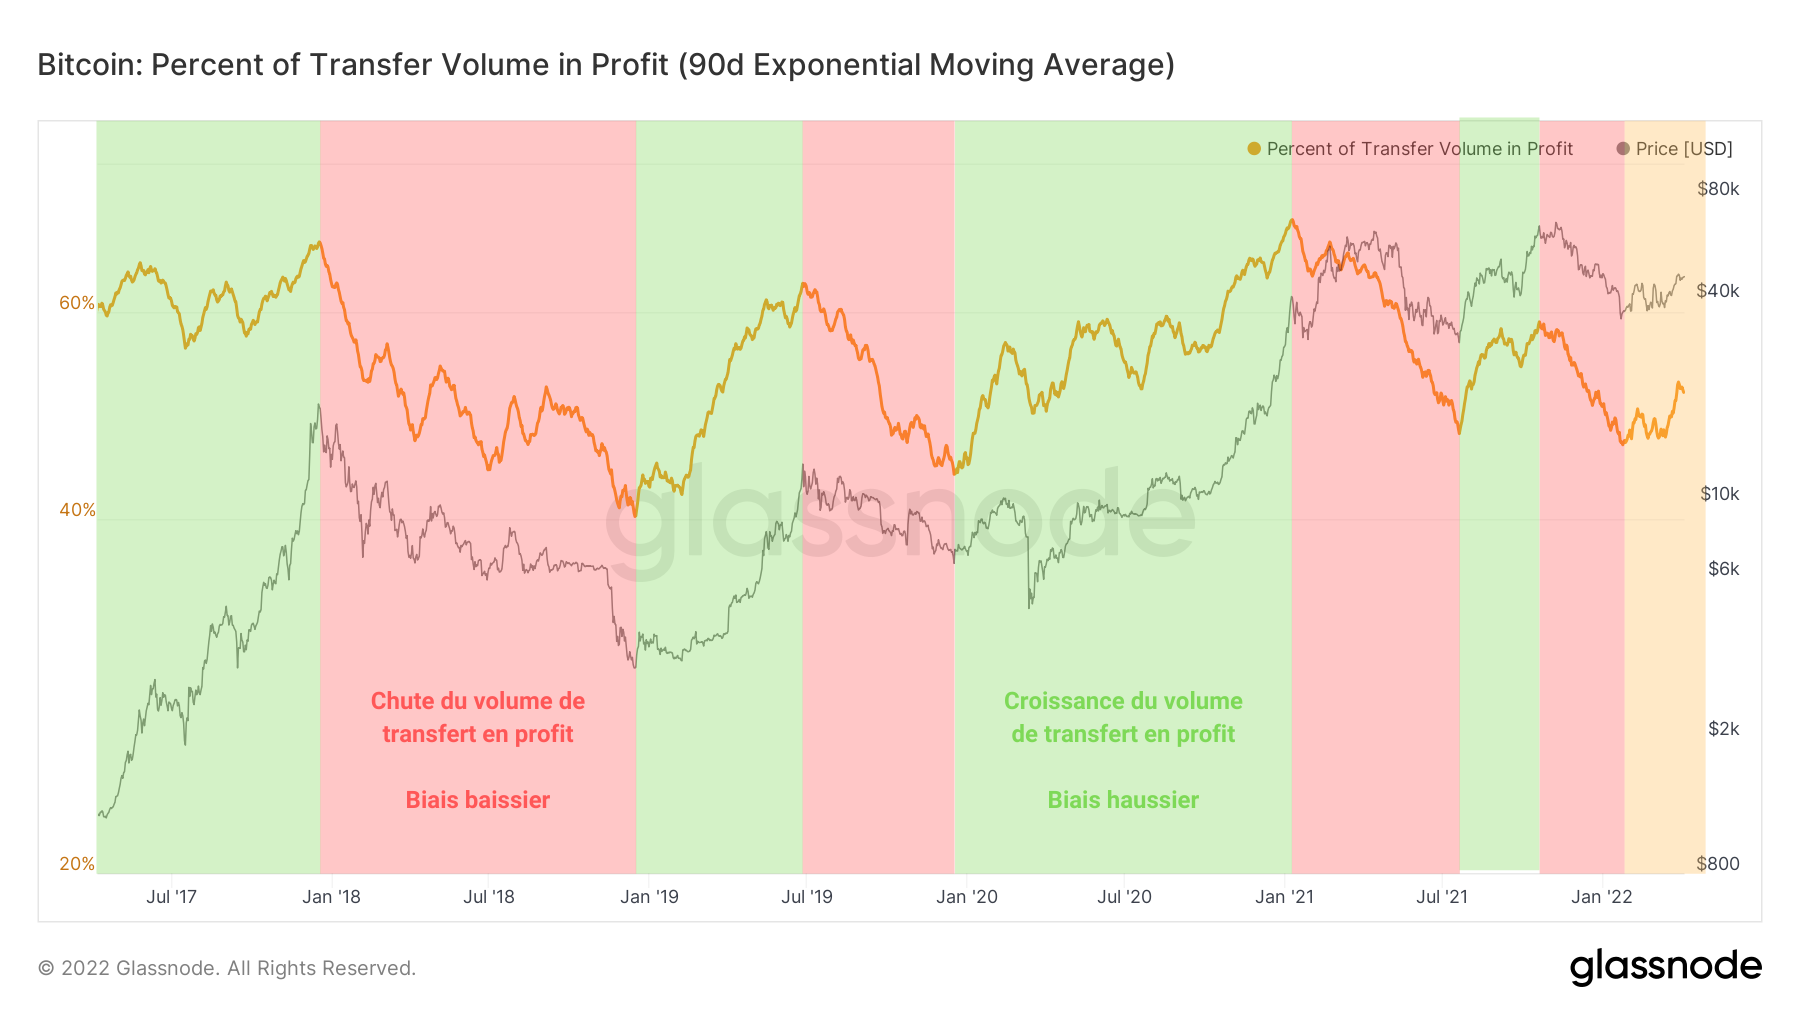
Figure 9: Percentage of Transfer Volume in Profit
Based on the volume percentage profit trend, we can easily identify:
- periods of corrections (red), during which the transferred BTC smolders increasing latent losses;
- bulls (green), periods where BTC appreciates in value and represent more than 40% of the total transfer volume.
Currently on the verge of starting a potential upside (yellow), the volume of profitable BTC traded on-chain exceeds 50% and indicates a very encouraging return to profitability for the coming weeks.
Market momentum bodes volatile move
Judging by the directional bias depicted by the realized market gradient (MRG) momentum over various time frames, it appears that the market is not yet quite ready to engage in upward momentum at long term .
Indeed, the momentum of the last 14 days, although positive and bullish, evolves within a contraction similar to that of the bear market of 2018. This behavior of the momentum causes a contraction of the volatility , which always ends up exploding at the up or down.
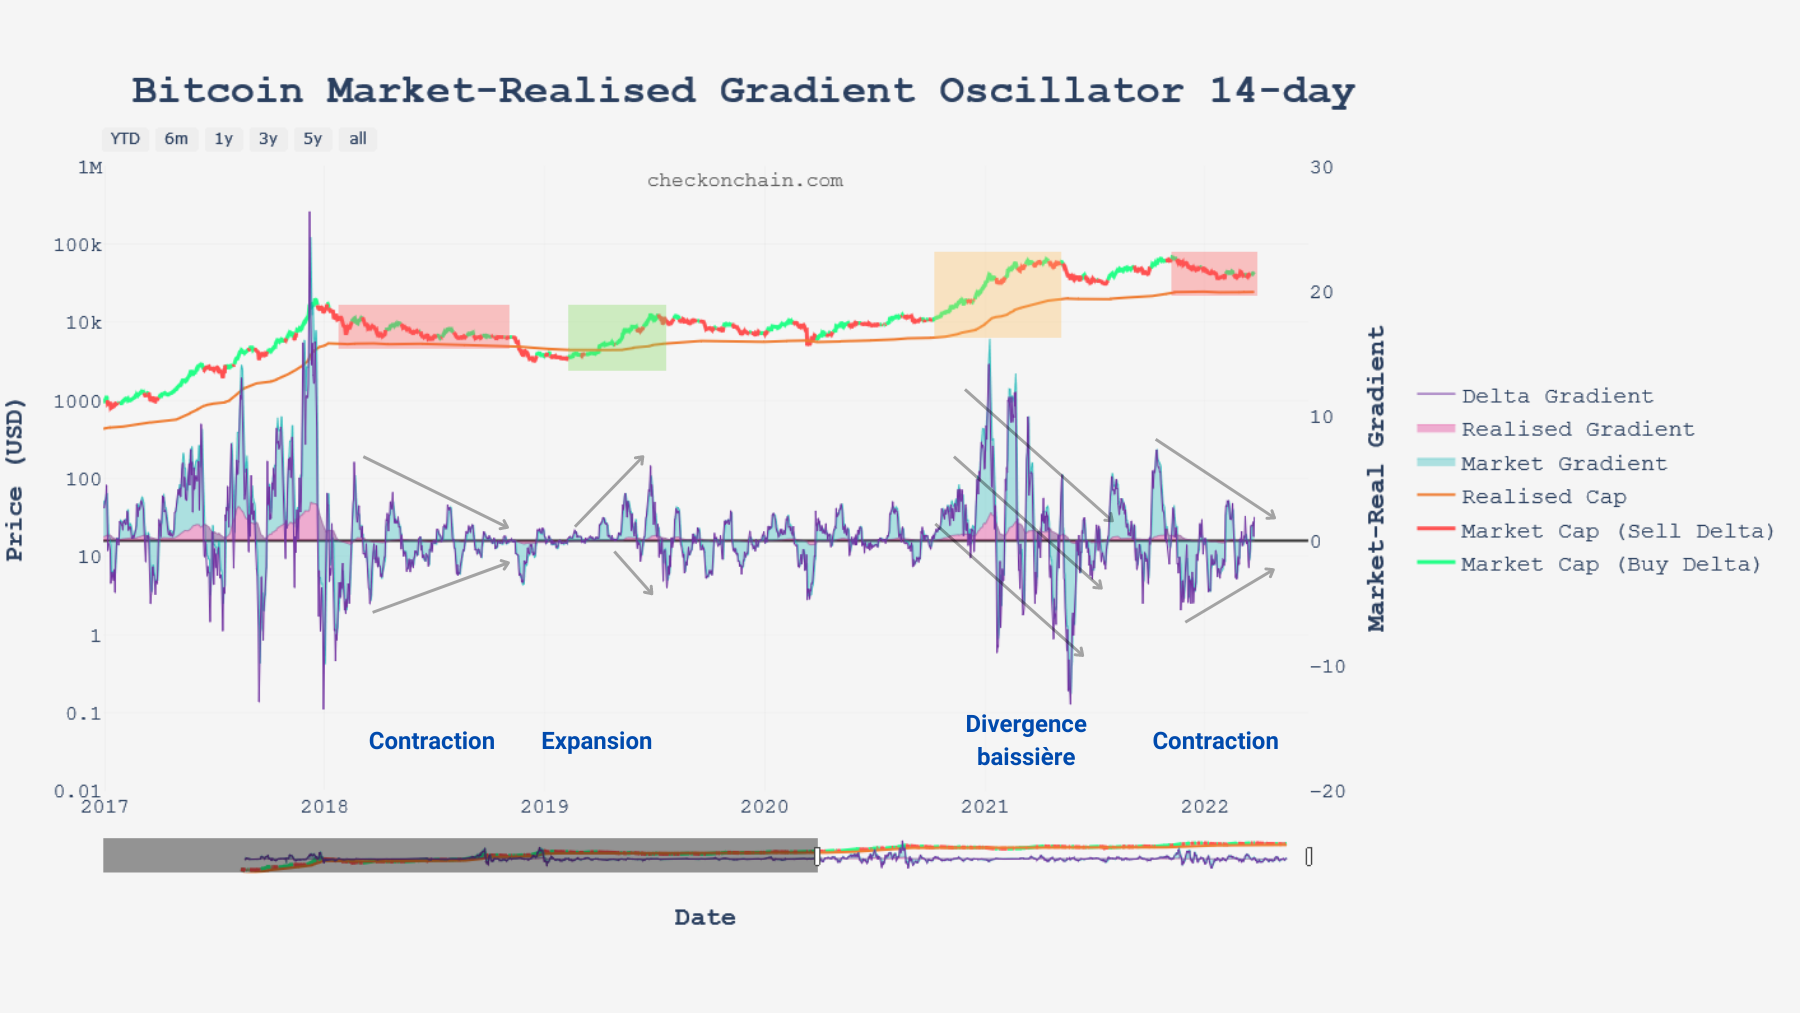
Figure 10: MRG-14
Thus, it is necessary to wait for the formation of an expansion pattern in order to assert that the momentum favors a viable rise.
Looking at the 28-day momentum, a similar scenario emerges, pointing to a contraction in momentum before a strong momentum whose direction is still unknown, although many argue for a new bull cycle.
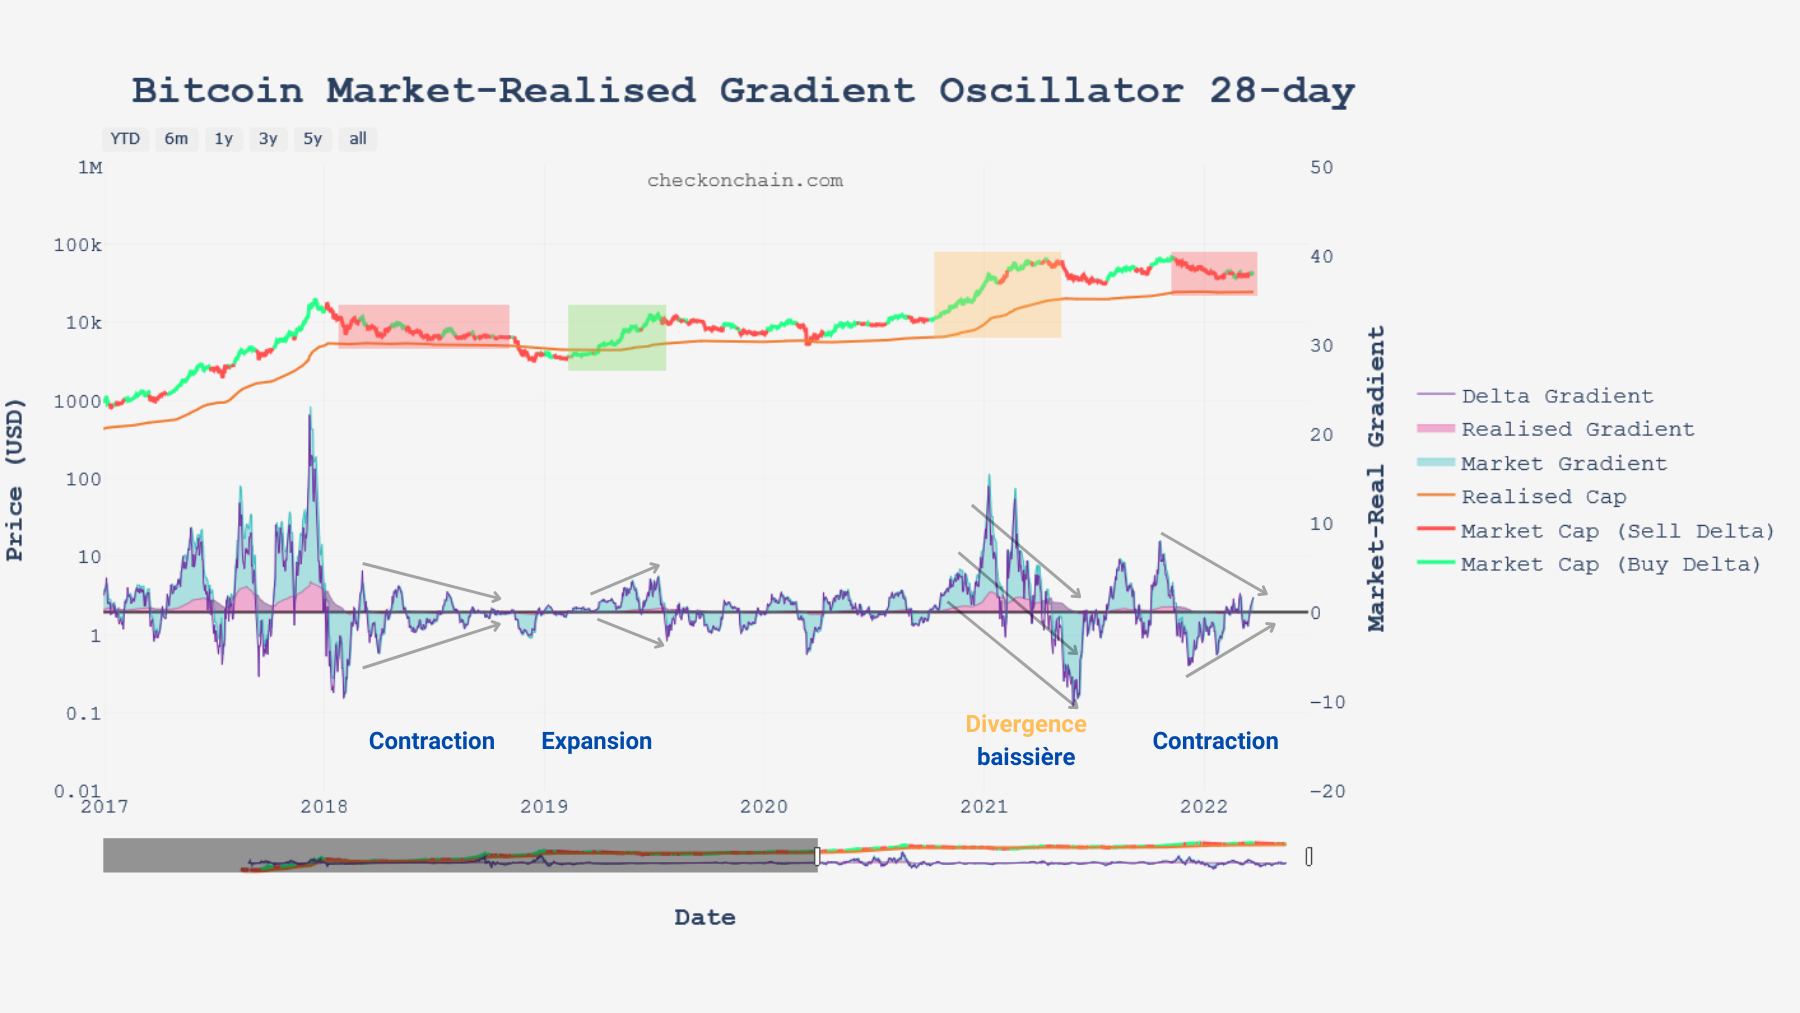
Figure 11: MRG-28
Finally, long-term momentum, measured over 140 days, remains in negative territory, with the pivot point having acted as resistance twice since the May sellout.
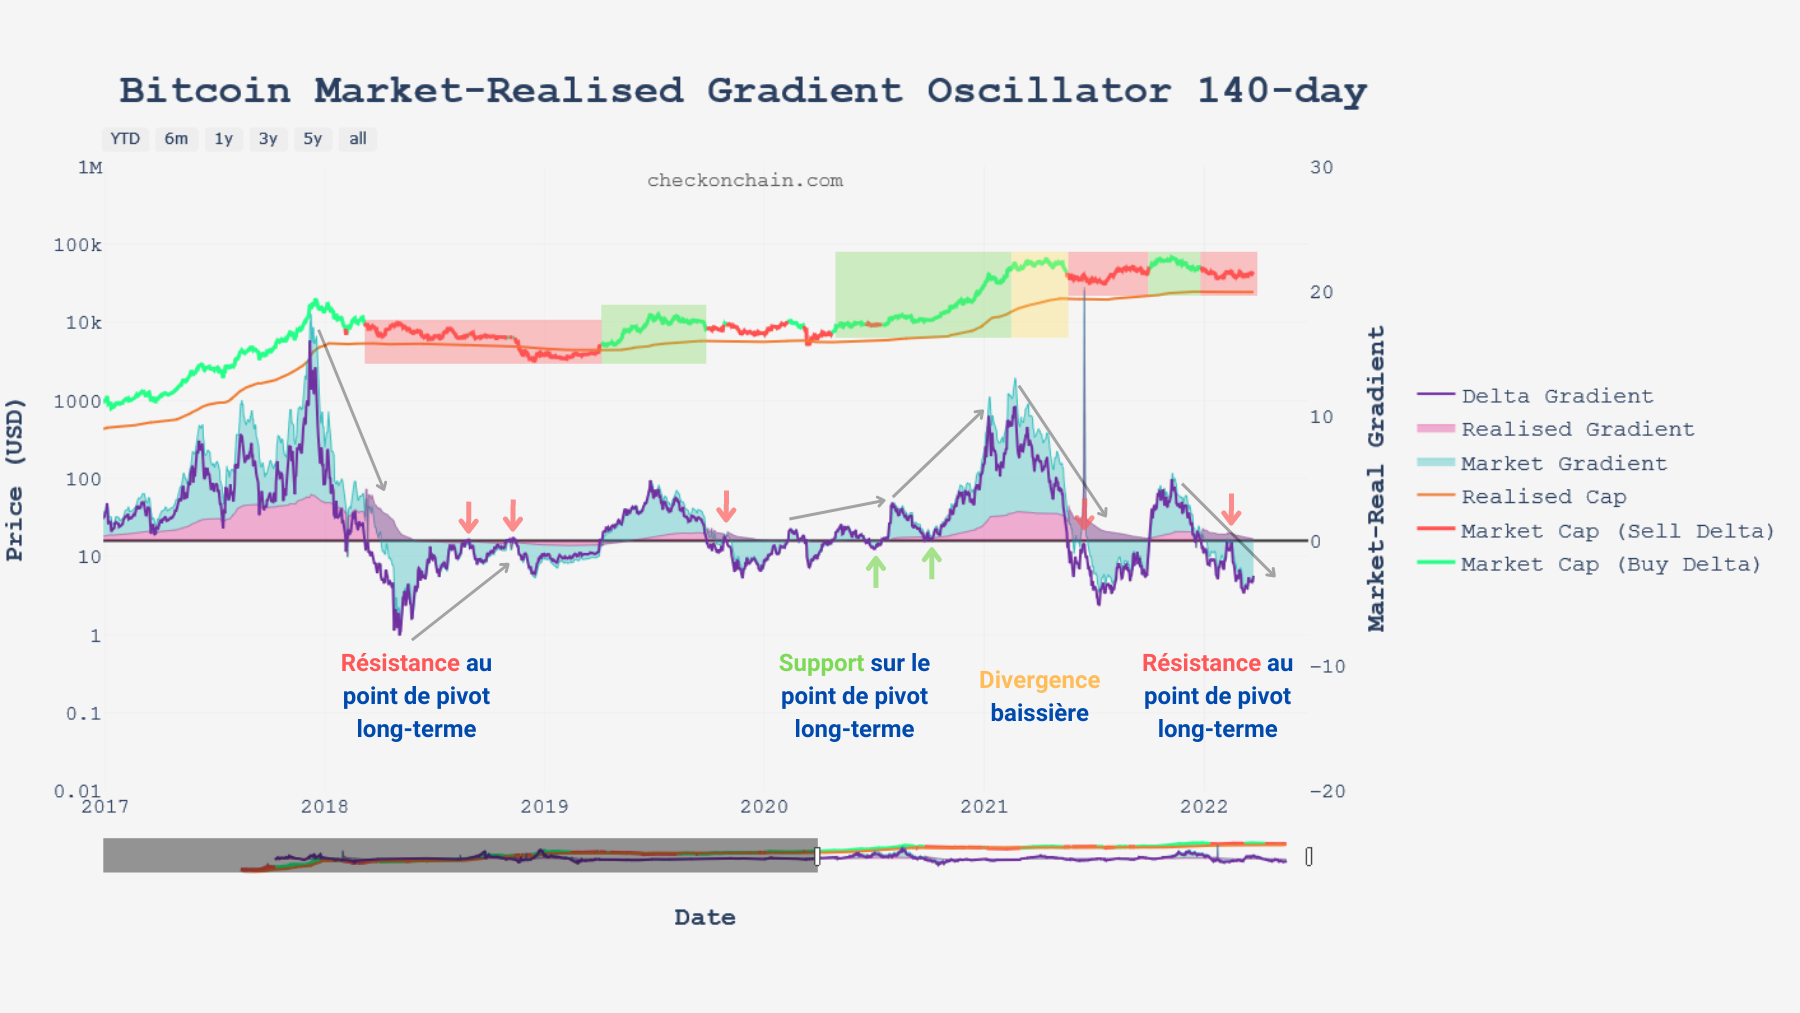
Figure 11: MRG-140
In view of this last indicator, it seems difficult to announce the advent of a sustainable rise before seeing the pivot point providing solid support for the long-term momentum on the market .
Summary of this on-chain analysis
Finally, this analysis indicates that the market is adopting a structure conducive to triggering a powerful upward movement .
The influx of new entities joining the network, coupled with the observation of growing on-chain activity indicates an encouraging renewed interest and engagement .
Note however that the volume of BTC transferred on the chain, adjusted by entities, mitigates this observation, testifying to a relatively low demand on the chain which cannot be explained by the influence of scalability solutions such as the Lightning Network since the Bitcoin network is currently very lightly congested.
To conclude, the short and mid-term market momentums indicate a contraction in price velocity, a precursor to a volatile movement whose direction is still unknown to us . We will also have to wait to see the long-term momentum print positive values above the pivot point before declaring the bears defeated.
Sources – Figure 1: Coinigy ; Figures 2 to 9: Glassnode ; Figures 10 to 12: checkonchain