Bitcoin (BTC) and Ether (ETH) are nearing the end of their daily chart pattern compression. Volatility is reduced, suggesting an unwinding of the range in the coming days.
Bitcoin is moving in a defining zone
The price of Bitcoin (BTC) has been stuck in a range between $33,700 and $45,000 for many weeks now . With price currently stuck in the middle of the range , the next few days should still be decisive.
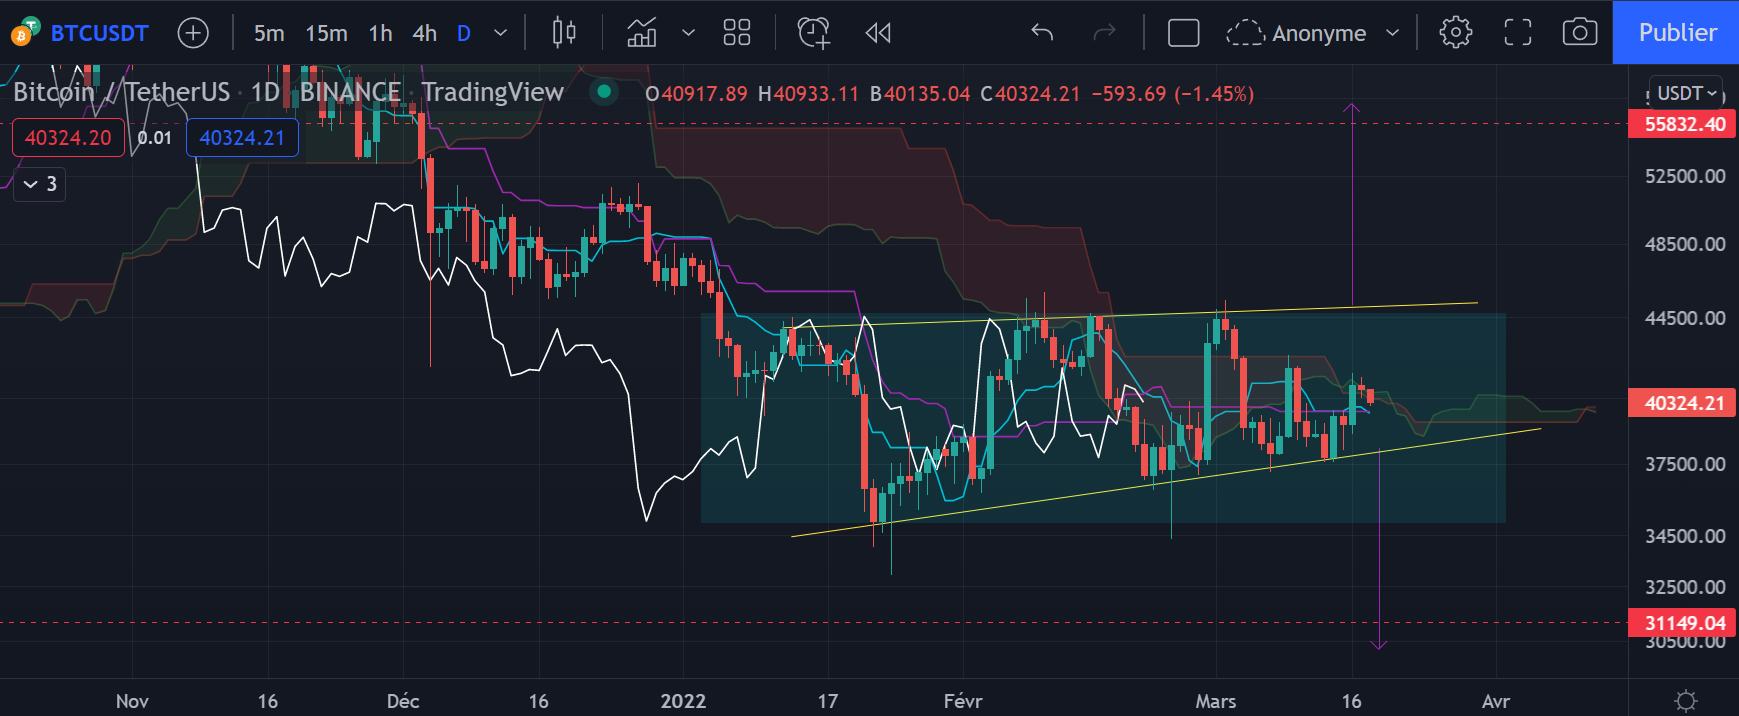
The daily chart of Bitcoin (Daily)
Indeed, when an asset evolves flat in the middle of a range, it is necessary to wait to see if it manages to break this level, or if it is finally rejected towards its support. BTC is currently facing the resistance represented by the cloud and will therefore imperatively have to pierce it upwards to aim for a return to the top of the range at $45,000 and then hope to break the Daily triangle in the direction of $55,800 .
If the price confirms a rejection on the middle of the range, the support of the triangle at $38,000 will be revisited, with a risk of a breakout from below and therefore a return of the price to the minimum at $35,000 (bottom of the range), or even up to the downside target of the triangle at $31,149 .
Ether must rebound
Still flat within its range, the price of Ether (ETH) is on the upper part of a triangle , ready for a breakout in the coming days.
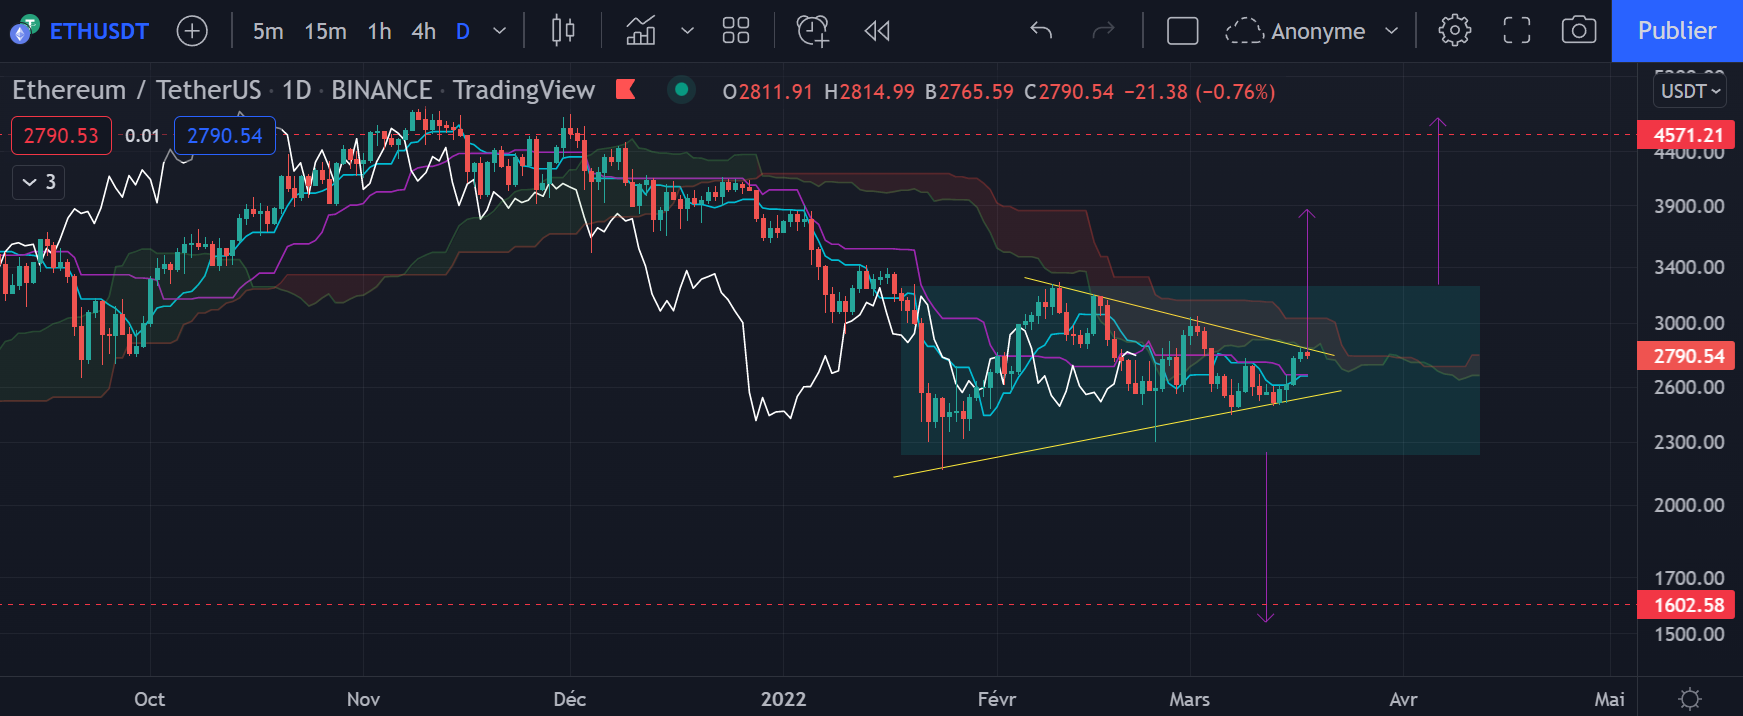
Ether (ETH) h4 chart
After several weeks of lateralization, the price is showing ETH compression with lower and lower volatility . In general, this type of pattern ends up triggering a strong movement in the direction of the breakout of the triangle.
Thus, it will be interesting to see in the next few days, if Ether manages to break its resistance from above (yellow trendline + cloud), or if it is again rejected in the direction of the bottom of the triangle.
A break through the top of the pattern and the cloud would cause the price to return to $3,700 (bullish triangle objective), or even to $4,571 (range breakout objective). Conversely, the breakout of the triangle from below would lead to a return to the low of the range at $2,300 , then if the range gives way lower, the downside target will be at $1,602 .
In conclusion
Cryptocurrencies are coming to the end of their compression, inside clearly visible triangles on the charts. In general, the breakout of a chart pattern triggers a strong volatile movement, the direction of the breakout will therefore soon allow us to define an objective to aim for in the medium term.